
Figure 4 |.
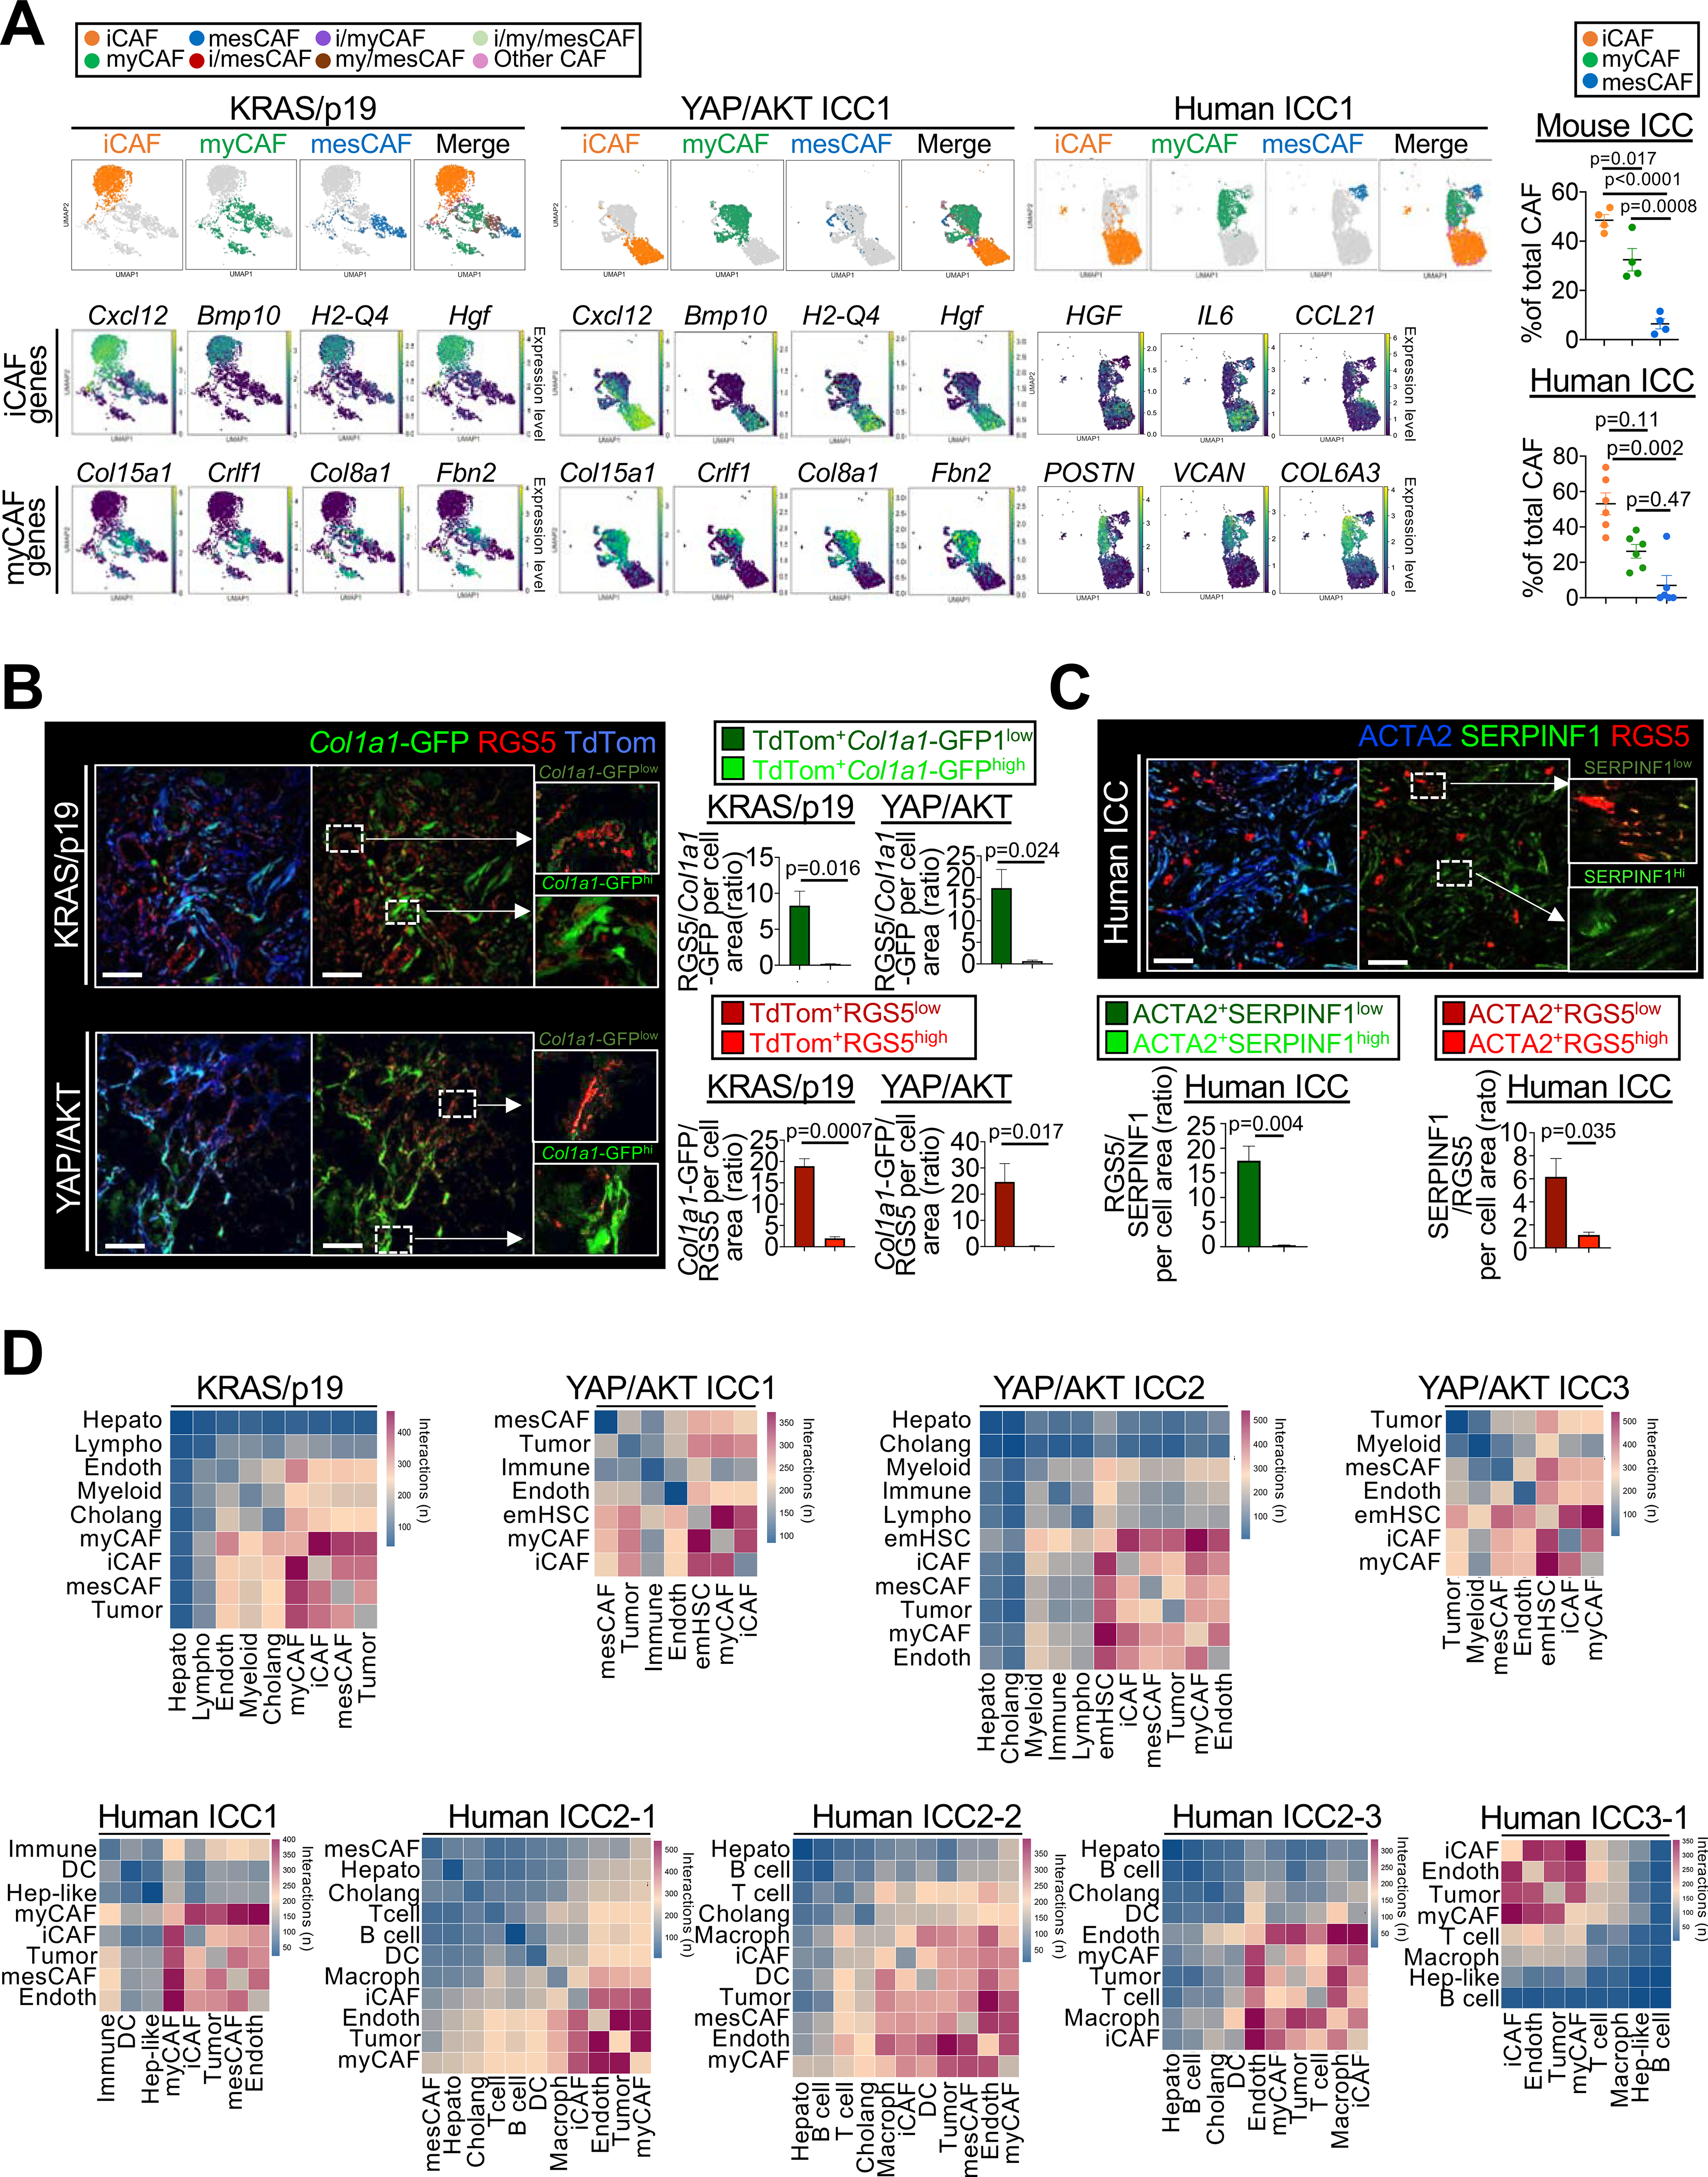
CAF subpopulations and their ligand-receptor interactome in ICC. (A) Representative UMAPs of indicated genes, CAF subpopulations and their percentages in KRAS/p19 (n=1), YAP/AKT-induced (n=3) and human ICC (n=6). Data shown as mean±SEM, significance determined by one-way ANOVA followed by Sidak’s posthoc test (mouse) or Kruskal-Wallis test with Dunn’s posthoc test (human). (B) Representative confocal microscopy and quantifications show high RGS5 in Col1a1-GFPlow iCAF and low RGS5 in Col1a1-GFPhigh myCAF in Lrat-Cre+ TdTom+Col1a1-GFP+ mice (n=3 tumors/model). Scale bars, 50 μm. Data shown as mean±SEM, significance determined by two-sided unpaired T-test. (C) Representative confocal microscopy and quantifications show high expression of iCAF marker RGS5 in cells with low expression of myCAF marker SERPINF1 and vice versa (n=3 tumors). Scale bars, 50 μm. Data shown as mean±SEM, and significance determined by two-sided unpaired T-test. (D) Representative heatmaps of CellphoneDB analysis showing the number of ligand–receptor interactions between iCAF, myCAF and mesCAF and all other cells in KRAS/p19 (n=1) and YAP/AKT ICC (n=3), and in human ICC (n=5).