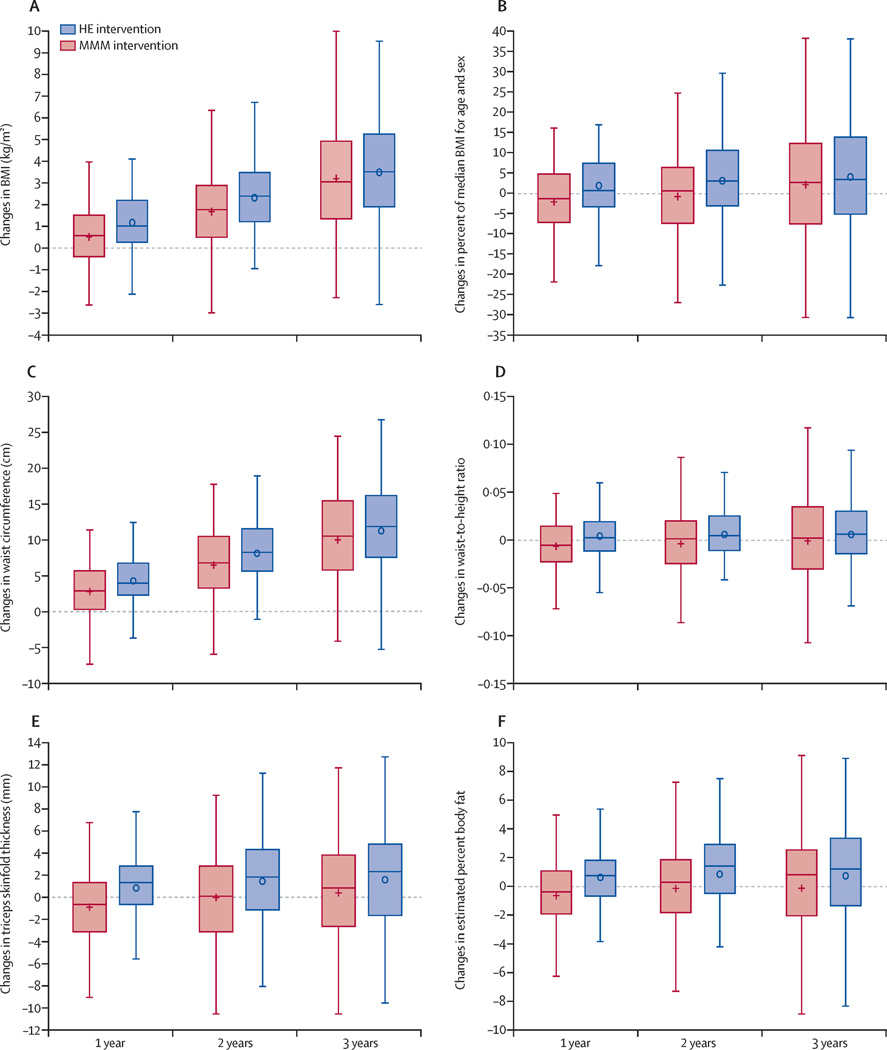
Figure 3: Changes in measures of adiposity over over 1 year, 2 years, and 3 years.
Box and whisker plots of changes in the MMM group (shown in red) and the Health Education group (shown in blue) over 1,2, and 3 years. The mean value is shown as a + (MMM) or o (Health Education) and the median is shown as a horizontal line across the centre of the box. The box shows IQR, bounded by the 75th percentile above and the 25th percentile below. The whiskers show the highest observed value at or within 1–5 times the IQR above the 75th percentile and below the 25th percentile. From all available data (238 individuals over lyear, 233 individuals over 2 years, 227 individuals over 3 years). Means and SD at each assessment timepoint and statistical significance for adjusted differences from the intention-to-treat analysis (241 individuals) are reported in table 2. HE=Health Education. MMM=multi-level, multi-settinq, multi-component.

