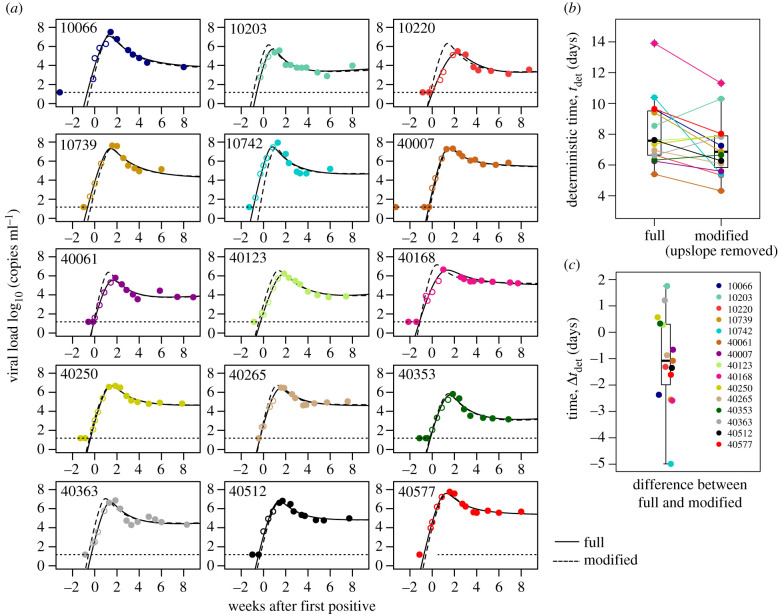
Figure 7.
Model estimates of individuals after removing observed upslopes. (a) Fifteen examples of participants including their original full fit (solid line) and a modified fit after removing data from the viral load upslope (dashed line, white circles are removed data). (b) Estimates for deterministic times using the full and modified data, and (c) difference in the estimate of deterministic time between full and modified fits shows a minor bias (median less than 2 days difference).

