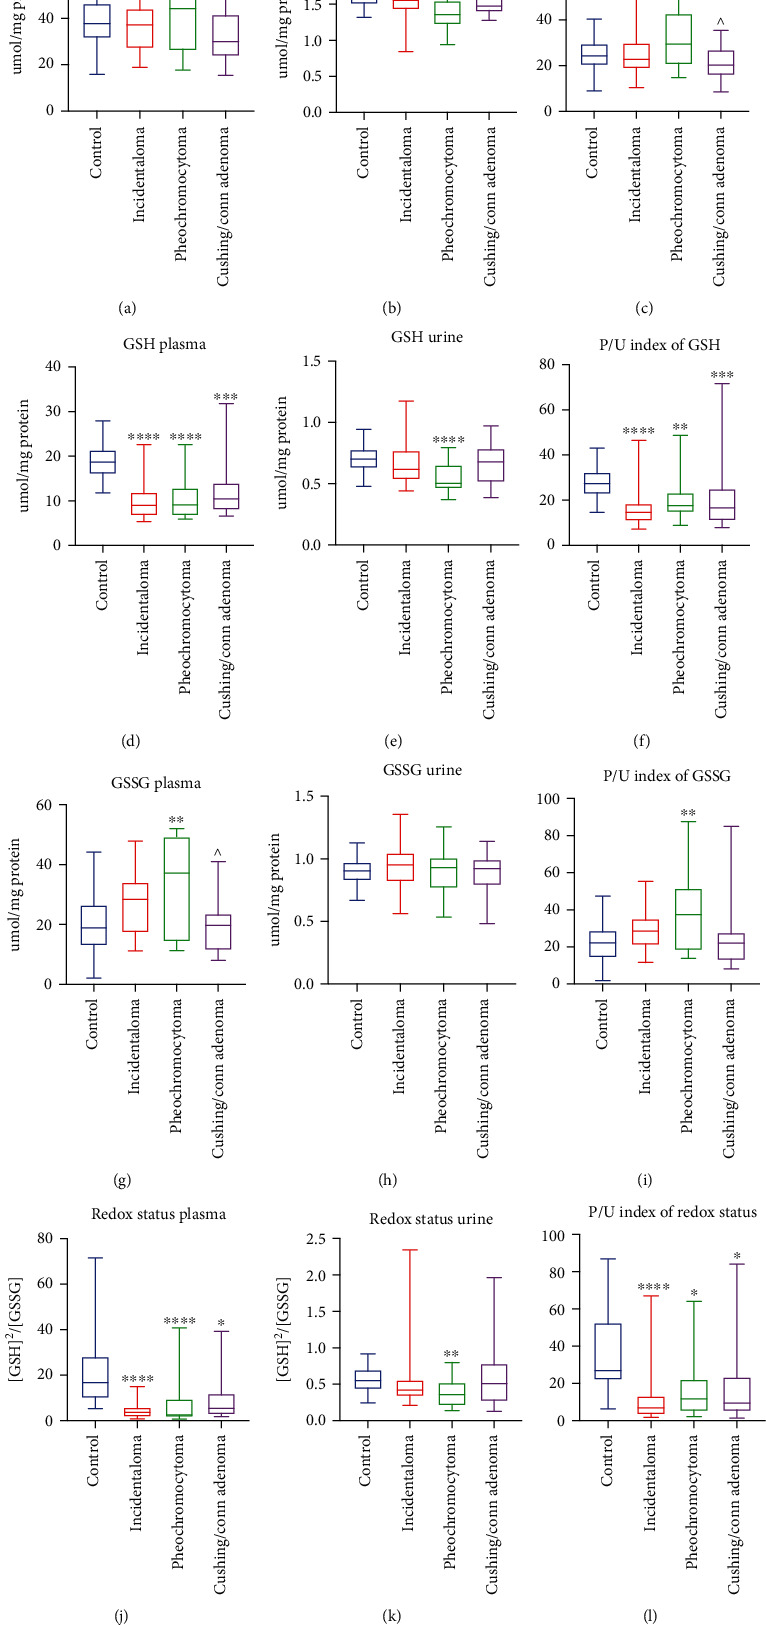
Figure 2.

Plasma and urine concentration, as well as plasma/urine index of total glutathione (a–c), reduced glutathione (GSH) (d, e, f), glutathione disulfide (GSSG) (g)–(i), and redox status (j)–(l) of the controls, incidentaloma, pheochromocytoma, and Cushing's/Conn's adenoma patients. Results are presented as median with minimum and maximum. ∗p < 0.05, ∗∗p < 0.01, ∗∗∗p < 0.001, and ∗∗∗∗p < 0.0001 indicate significant differences from the controls; ^p < 0.05 indicates significant differences from the pheochromocytoma group.
