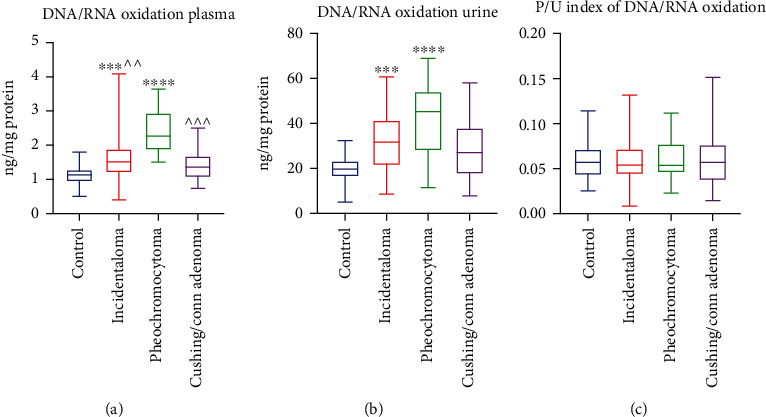
Figure 6.

Plasma and urine DNA/RNA oxidation products (a, b) and plasma/urine index of DNA/RNA oxidation product content (c) of the controls, incidentaloma, pheochromocytoma, and Cushing's/Conn's adenoma patients. Results are presented as median with minimum and maximum. ∗∗∗p < 0.001 and ∗∗∗∗p < 0.0001 indicate significant differences from the controls; ^^p < 0.01 and ^^^p < 0.001 indicate significant differences from the pheochromocytoma group.
