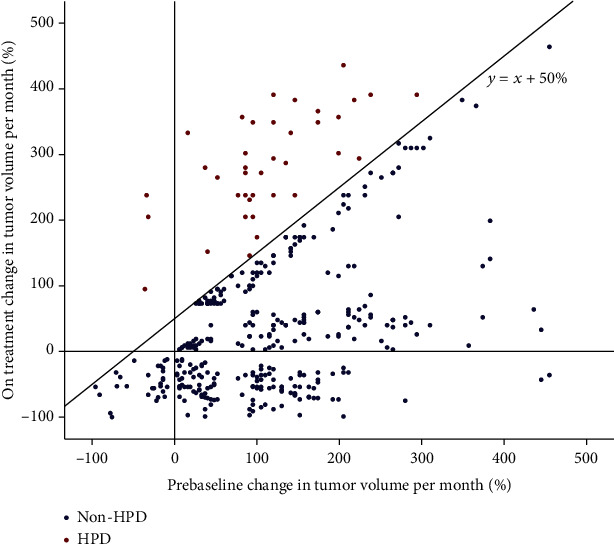
Figure 2.

Blue spots show 339 patients with nonhyperprogressing disease (non-HPD). Red spots show 38 patients with hyperprogressive disease (HPD) during PD-1 inhibitor therapy.

Blue spots show 339 patients with nonhyperprogressing disease (non-HPD). Red spots show 38 patients with hyperprogressive disease (HPD) during PD-1 inhibitor therapy.