Fig. 12.

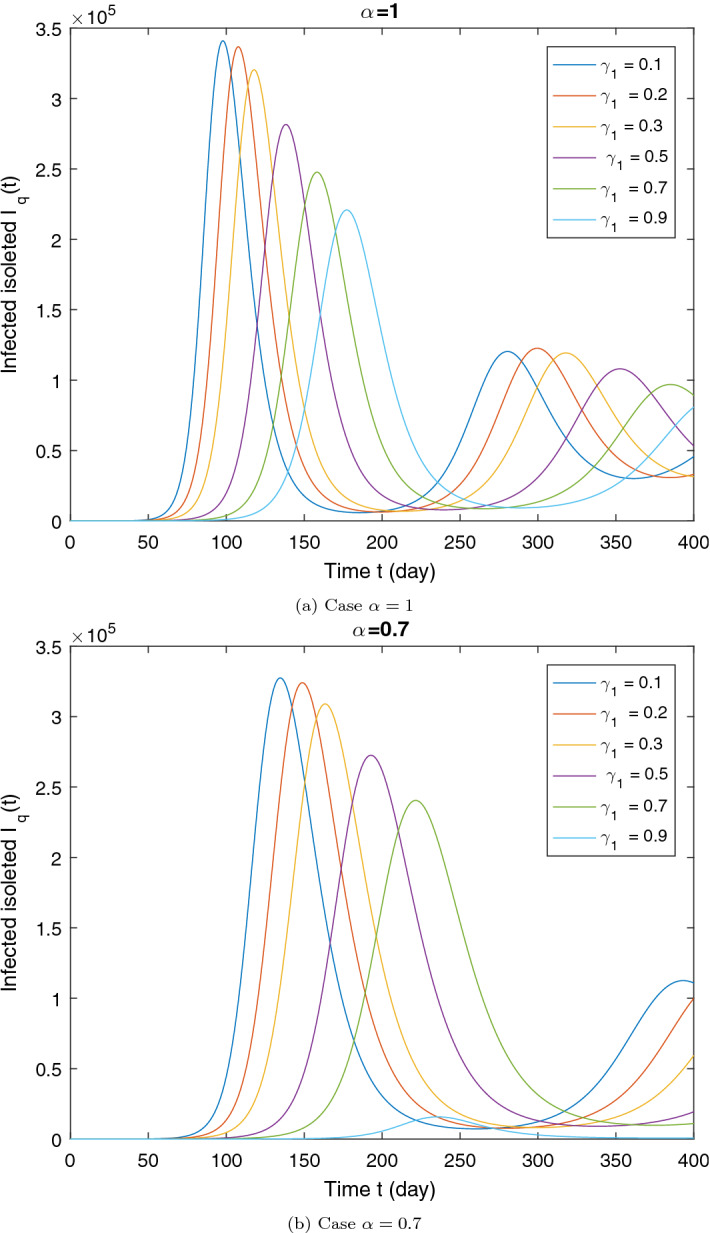
Illustration of the impact of isolation rate on the dynamics of the infected quarantined () for two values of . All other parameters are given in the Table 1. The initial conditions are the same of the Section 7.2

Illustration of the impact of isolation rate on the dynamics of the infected quarantined () for two values of . All other parameters are given in the Table 1. The initial conditions are the same of the Section 7.2