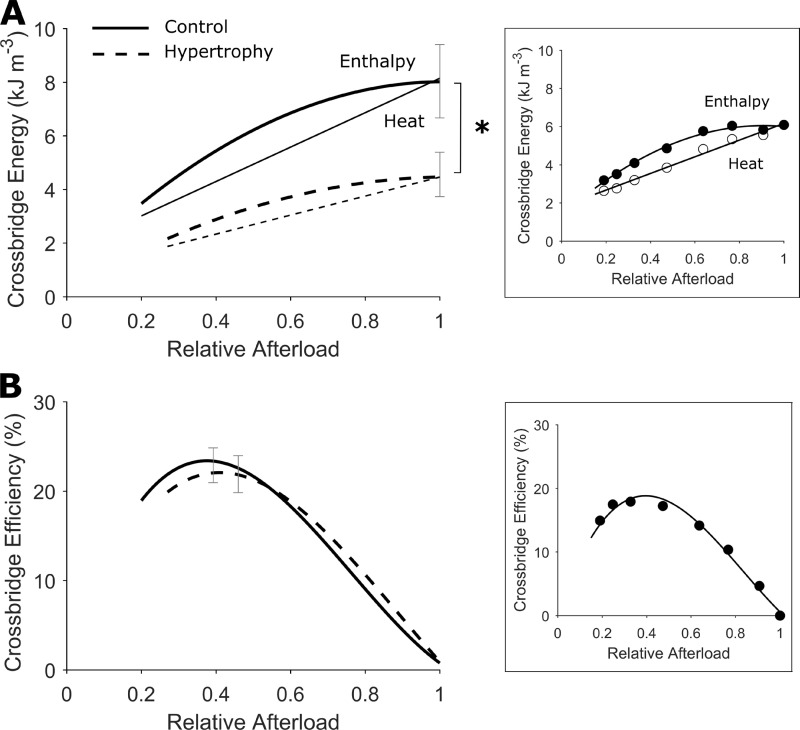
Figure 8.
Lower trabecula cross-bridge enthalpy and preserved cross-bridge efficiency. (A) Cross-bridge heat was quantified by subtracting activation heat (estimated from the y intercept of the heat-stress relation in Fig. 5 A) from active heat. Cross-bridge enthalpy is thus the sum of cross-bridge heat and work output. The average relations of cross-bridge heat and afterload (relative to peak total stress obtained at Lo) were fitted using linear regression (thin lines). The average relations of cross-bridge enthalpy and relative afterload were fitted using quadratic regression (thick lines). (B) Cross-bridge efficiency is the ratio of work to cross-bridge enthalpy. The average relations of cross-bridge efficiency and afterload (relative to peak total stress obtained at Lo) were fitted using quadratic cubic regression with both variables constrained at the origin. The regression lines are drawn to commence at relative passive stress. Control rat (solid lines), hypertrophic rat (broken lines), n = 12 trabeculae. SEM is superimposed at peak values for each dependent variable. The difference between regression lines was analyzed by the random coefficient model; *, P < 0.05. Insets in each panel show data from an exemplar trabecula.

