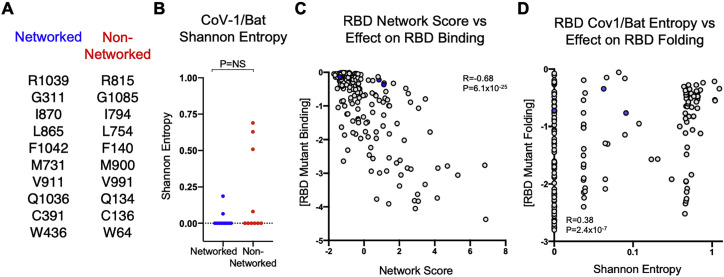
Figure S4.
Shannon entropy values for residues mutated in SARS-CoV-2 spike protein and correlations of spike RBD values with functional mutagenesis data, related to Figure 2
(A) List of matched pairs of networked and non-networked residues in the SARS-CoV-2 Spike proteins targeted for mutagenesis. (B) Comparison of Shannon entropy values between networked residues and non-networked residues in the Sarbecovirus subgenus (SARS-CoV-1/Bat CoV), respectively. (C) Scatterplot of network score of RBD and average effect of mutation on monomeric RBD binding. Statistical comparisons were made using Mann-Whitney U test. (D) Scatterplot of SARS-CoV-1/Bat Shannon entropy values for the RBD and average effect of mutation on monomeric RBD folding. Correlations were calculated by Spearman’s rank correlation coefficient. Calculated P values were as follows: ∗p < 0.05; ∗∗p < 0.01; ∗∗∗p < 0.001; ∗∗∗∗p < 0.0001.

