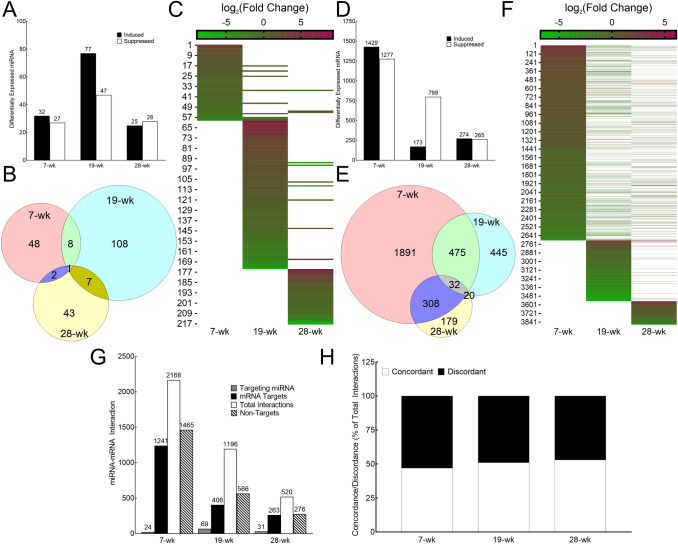
Fig. 2.
Chronic As3+ exposure changes the landscape of differentially expressed miRNAs and mRNAs in a longitudinal manner. A Bar graph showing the number of miRNA molecules at 7, 19 and 28-wk time points differentially expressed in HaCaT cells exposed to 100 nM As3+ compared with passage matched unexposed controls (induced: closed bars; suppressed: open bars). Differential expression is defined as p_Eq < 0.05. B Venn diagram depicting the distribution of differentially expressed miRNAs (p_Eq < 0.05) at each time point along with the number of overlaps at different time points. C Heat Map of differentially expressed miRNA molecules at 7, 19 and 28-wk. The numerals on the y axis refers to the serial numbers assigned to the differentially expressed miRNA molecules in Supplementary Table 2. The color code bar on top refers to the log2 (Fold Change) expression values. Absence of a bar (represented by white) signifies either that miRNA molecule was not detected at that time point or was not differentially expressed at that time point. D Bar graph showing the number of mRNA molecules at 7, 19 and 28-wk time points differentially expressed in HaCaT cells exposed to 100 nM As3+ compared with passage matched unexposed controls (induced: closed bars; suppressed: open bars). Differential expression is defined as p < 0.01 and FC ± > 30%. E Venn diagram depicting the distribution of differentially expressed mRNAs (p < 0.01 and FC ± > 30%) at each time point along with the number of overlaps at different time points. F Heat Map of differentially expressed mRNA molecules at 7, 19 and 28-wk. The numerals on the y axis refers to the serial numbers assigned to the differentially expressed miRNA molecules in Supplementary Table 3. The color code bar on top refers to the log2 (Fold Change) expression values. Absence of a bar (represented by white) signifies either that mRNA molecule was not detected at that time point or was not differentially expressed at that time point. G Expression pairing between differentially expressed miRNA and differentially expressed mRNA at 7, 19 and 28-wk. For each time point, shown are the total number of differentially expressed miRNA molecules that are targeting one or more differentially expressed mRNA molecules (light grey bars); the number of differentially mRNA molecules that are targeted by one or more or differentially expressed miRNA molecules (closed bars), total number of miRNA-mRNA pairings (open bars) and the number of differentially expressed mRNA molecules that are not predicted to be targeted by any differentially expressed miRNA molecule (hatched bars). h Concordance–discordance relationship between differentially expressed miRNA and differentially expressed mRNA at 7, 19 and 28-wk. The data is presented as % of total interactions predicted at that time point

