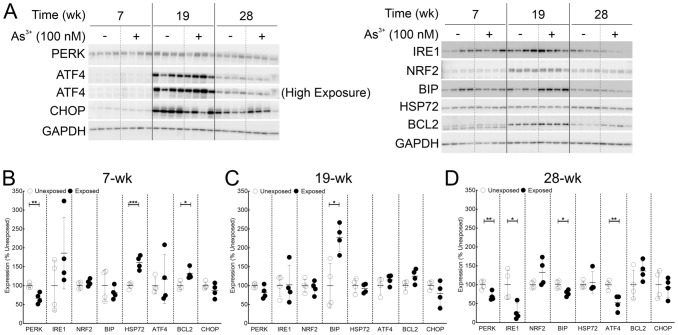
Fig. 4.
Immunoblot analysis validates dysregulation of ER stress pathway predicted by RNA-seq data analyses at the protein level. A Immunoblot for ER stress markers at 7, 19 and 28-wk time points in HaCaT cells exposed to 100 nM As3+ or passage matched unexposed controls. B Densitometric analysis of ER stress marker expression at 7-wk. C Densitometric analysis of ER stress marker expression at 19-wk. D Densitometric analysis of ER stress marker expression at 28-wk. Protein expression data in panels B–D are plotted as means ± SD and expressed as % mean unexposed. Statistical analysis was done by unpaired two-tailed t-test; *p ≤ 0.05, **p ≤ 0.01; ***p ≤ 0.001

