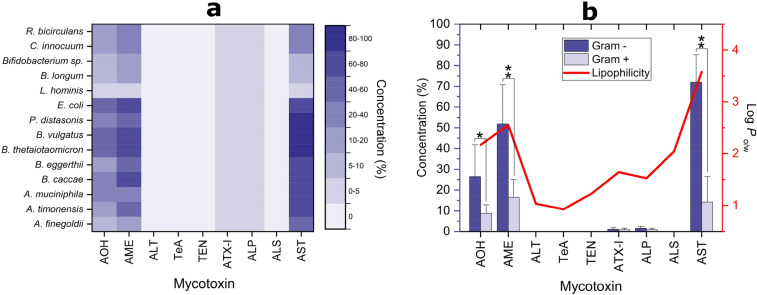
Fig. 5.
Recoveries of mycotoxins from bacterial pellets. a Heatmap showing the average amount (in % compared to the total amount recovered) of mycotoxins found after 24 h incubation with 25 µg/mL of CE in pellets of all strains tested. b Double-axis plot showing mean ± SD (in % compared to the total amount recovered) of mycotoxin concentrations found in pellets of Gram-negative and positive strains (blue and light blue columns, respectively; left axis), and the mean value of theoretical lipophilicity (solid line; right axis) of mycotoxins. Significant differences between Gram-negative and -positive strains were evaluated by Student’s t test (*p < 0.05; **p < 0.01)

