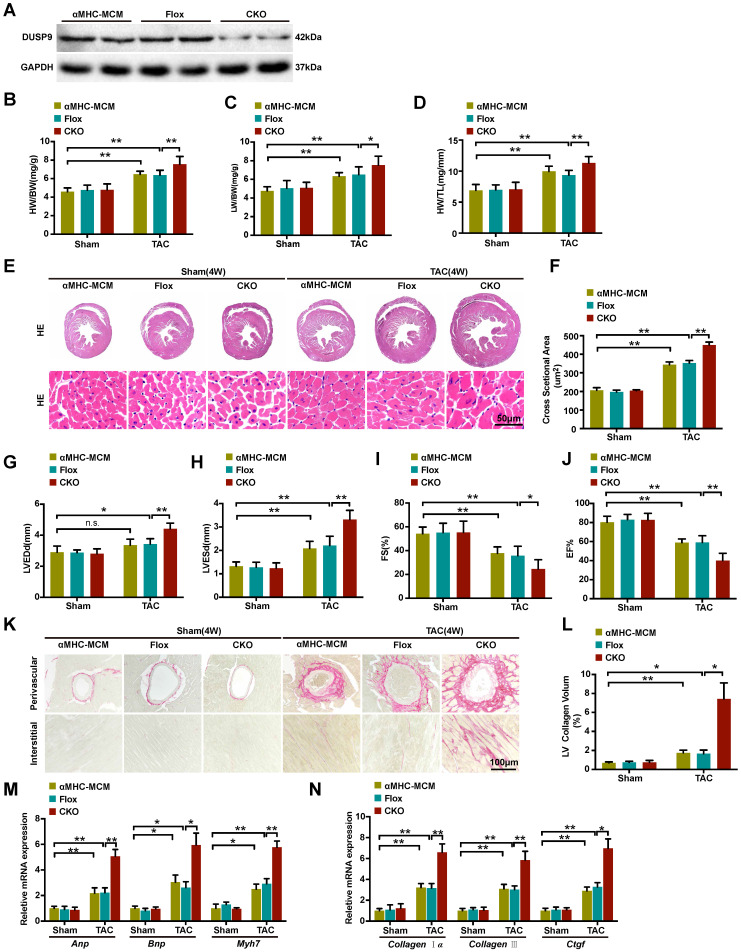
Figure 2.
Cardiac DUSP9 deficiency exacerbated TAC-induced cardiac hypertrophy. (A) Representative western blot results to validate DUSP9 expression in αMHC-MCM, DUSP9-Flox and DUSP9-CKO mice (n = 6 per experimental group). (B-D) Statistical data of the ratios of Heart weight to body weight (HW/BW, B), lung weight to body weight (LW/BW, C) and heart weight to tibia length (HW/TL, D) in different genotypical mice (αMHC-MCM, DUSP9-Flox and DUSP9-CKO) at four weeks after sham or TAC procedures (n = 10 mice per group) (E, F) Histological analysis of gross morphology and left ventricular muscle of demonstrated groups four weeks after TAC surgery or sham procedures (n = 6 mice per group; scale bar, 50 µm). (G-J) Echocardiographic assessment of left ventricular end-diastolic diameter (LVEDd, G), left ventricular end-systolic diameter (LVESd, H), left ventricular fractional shortening (FS%, I) and left ventricular ejection fraction (EF%, J) in the demonstrated groups at four weeks after either sham or TAC procedures (n = 10 mice per group). (K, L) Representative imaging of PSR staining of perivascular and myocardial interstitial sections of the hearts from the demonstrated groups (n = 6 mice per group; scale bar, 100 µm) (M, N) Quantification results exhibiting the mRNA levels of hypertrophic biomarkers (Anp, Bnp, Myh7) and fibrotic markers (collagen Iα, collagen III, Ctgf ) in the indicated groups (n = 4 per group). Results are presented as mean ±SD. *P<0.05, **P<0.01.

