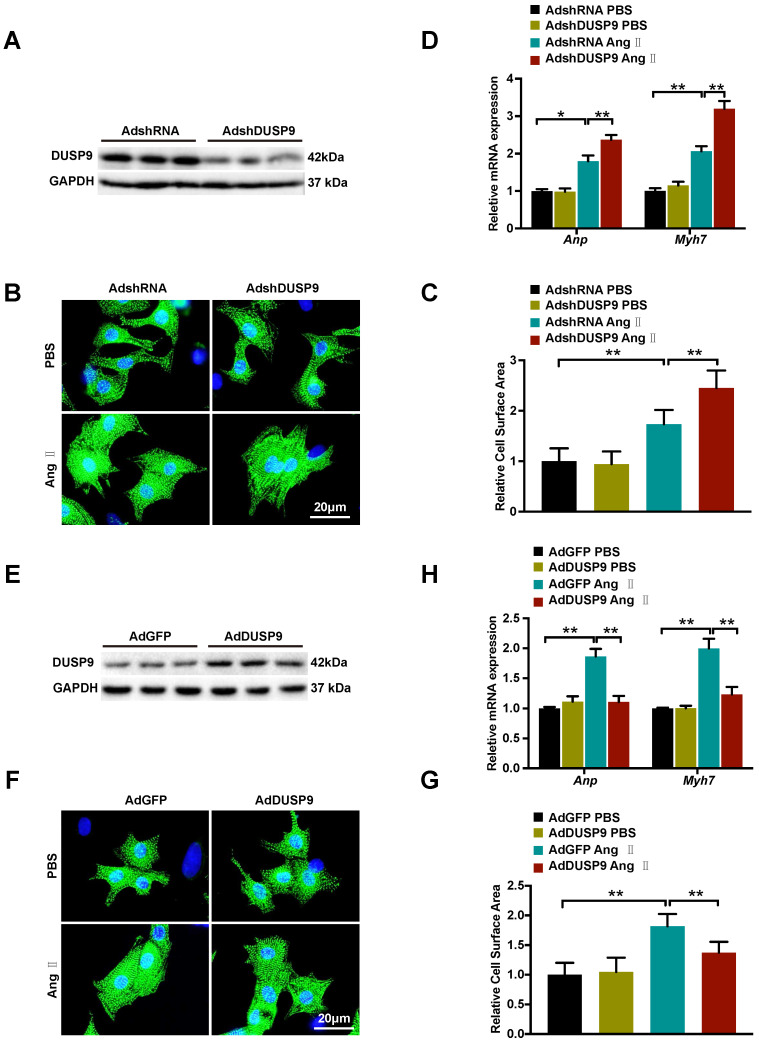
Figure 4.
DUSP9 repressed Ang II-induced NRVM hypertrophy in vitro. (A) Respective western blots showing DUSP9 expression in NRVM infected with adenoviral vectors with shDUSP9 or controls (B, C) Representative immunofluorescence images of NRVM stained with α-actinin (green) and DAPI (blue) after infection by adenovirus of vectors with shDUSP9 or controls followed with a 48h-challenge of PBS or Ang II (1 µM). (D) The mRNA level of hypertrophic marker genes (Anp and Myh7) in NRVM after adenoviral vectors with shDUSP9 or controls infections undergoing Ang II (1 µM) or PBS treatment for 48 h (E) Respective western blots showing DUSP9 expression in NRVM infected with adenoviral vectors with Flag-DUSP9 or controls. (F, J) Representative immunofluorescence images of NRVM stained with α-actinin (green) and DAPI (blue) after the infections with adenoviral vectors with Flag-DUSP9 or controls followed by 48 h of PBS or Ang II (1 µM) challenge. (H) The mRNA levels of hypertrophic biomarkers (Anp and Myh7) in NRVM infected with adenoviral vectors with Flag-DUSP9 or controls undergoing Ang II (1 µM) or PBS for 48 h. Data are presented as the mean ±SD. *P<0.05, **P<0.01; NRVM refers to neonatal rat ventricular myocytes.

