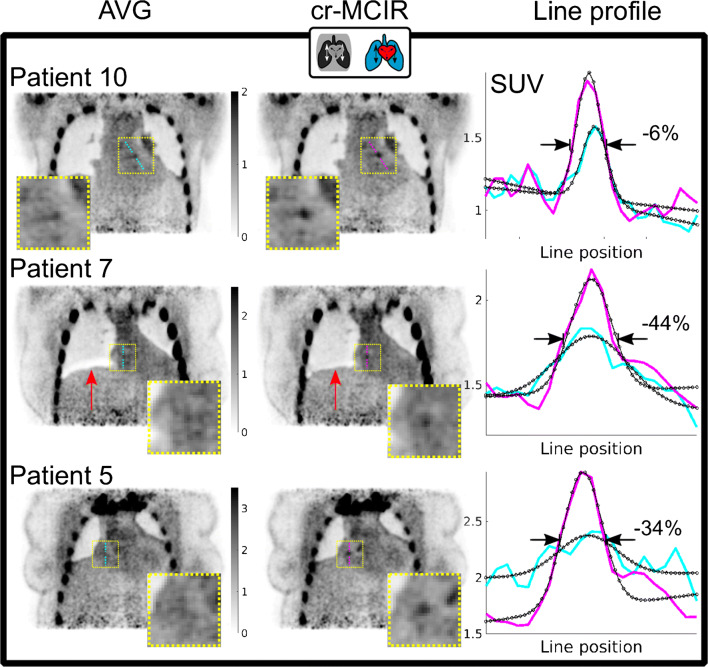
Fig. 3.
Comparison between PET AVG (left column) and cr-MCIR (centre column) for patients 10, 7 and 5. Cyan and magenta lines indicate the position where line profiles (right column) were extracted. The fit is overlayed in black. Compared to AVG, cr-MCIR leads to an increase in the maximum uptake value and a decrease of plaque width D. The decrease ranged between −6 and −44% for the displayed cases. Patient 7 shows an artefact due to misalignment between AC map and PET emission data for AVG which is corrected by using cr-MCIR (red arrow)

