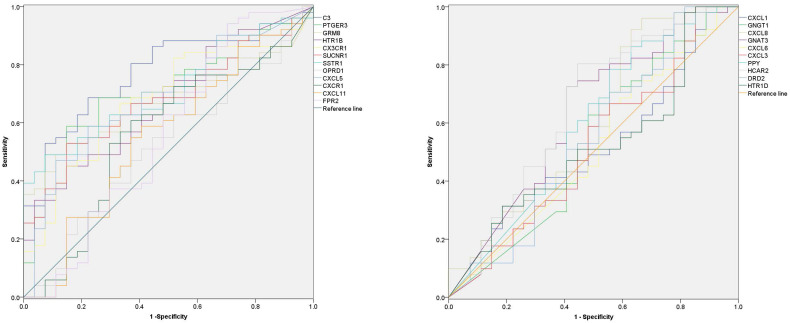
Figure 5.
The diagnostic value of 22 hub-genes in distinguishing the death and survival groups, the ROC curve found that nine hub-genes (C3, CXCL5, CX3CR1, GRM8, HCAR2, HTR1B, SUCNR1, PTGER3 and SSTR1) could be used to distinguish the death and survival groups (the p-value for each gene in Table 3).

