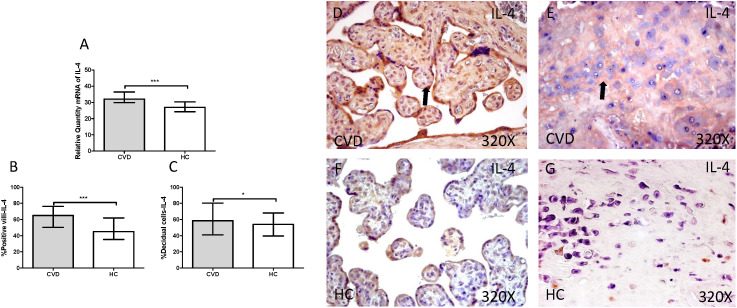
Figure 12.
A. mRNA expression levels for IL-4 by RT-qPCR. B. Percentage of placental villi with positive protein expression for IL-4 by using immunochemistry techniques. D-G. Images where immunoexpression of IL-4 is showed in placental villi (D and F) and in decidual cells (E and G). CVD=Women with diagnosed gestational chronic venous disease. HC= Venous control p<0.05 (*), p<0.01 (**), and p<0.001 (***). Arrow=shows positive expression of the protein.

