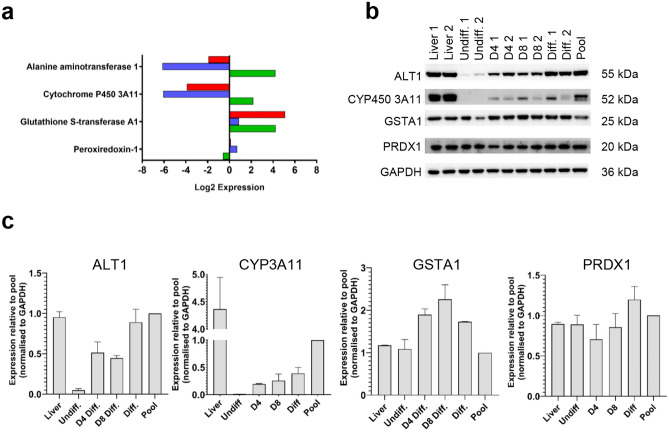
Fig. 5.
Comparison of relative protein expression levels by iTRAQ and immunoblotting. a Log2 fold difference in expression of DMET and NRF2 proteins detected by iTRAQ. b Immunoblot of DMET and NRF2 proteins in liver and hepatic organoids at various stages of differentiation (n = 2). c Densitometric analysis of DMET and NRF2 proteins relative to GAPDH showed a similar protein expression to that observed by iTRAQ analysis.  differentiated v liver,
  undifferentiated v liver,
  differentiated v undifferentiated (color figure online)

