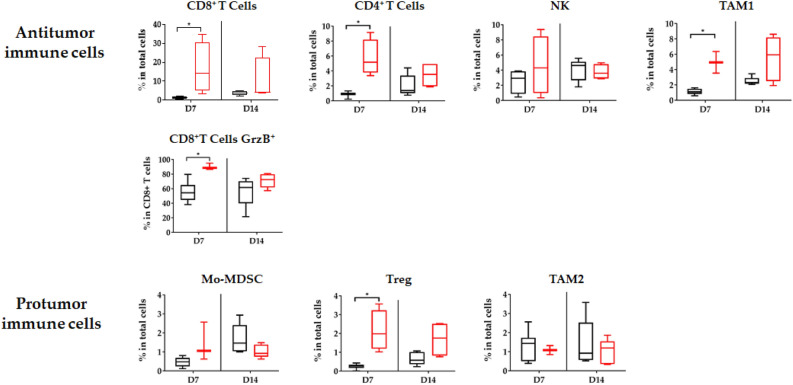
Figure 4.
Modification of the tumor microenvironment induced by proton therapy: immunomonitoring of lymphoid and myeloid cells after proton therapy. At 7 and 14 days after PT, flow cytometry monitoring (FCM) was performed on dissociated tumors. Antitumor immune cell (CD8+ T cells, CD4+ T cells, Natural Killer (NK) cells, tumor associated macrophages (TAM) 1 and CD8+ Granzyme B+ (GrzB) and pro-tumor cell (myeloid derived suppressor cells (Mo-MDSC), Treg T cells and TAM2) infiltration was quantified. Black: non-irradiated control, Red: 16.4 Gy PT. All data were expressed in percentages of total cells, except for CD8+T cells Granzyme B+ which were expressed in percentages of CD8 + T cells. All data are shown with box and whisker plots, with min to max values obtained from 4–5 independent samples per point. The results are expressed as mean ± SEM. The non-parametric Mann–Whitney test was used. *p < 0.05.

