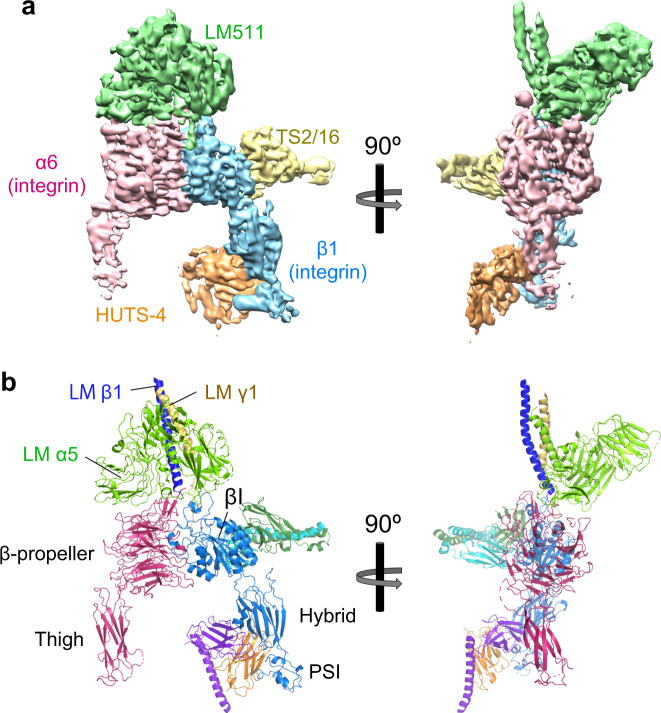
Fig. 3. Cryo-EM structure of a quaternary complex of the α6β1 headpiece, tLM511, TS2/16 Fv-clasp, and HUTS-4 Fv-clasp.
a Cryo-EM density map. The map is colored as follows; integrin α6 subunit in pale pink, integrin β1 subunit in light blue, LM511 in pale green, TS2/16 Fv-clasp in pale yellow, and HUTS-4 Fv-clasp in pale orange. The map is drawn at the contour level of 0.05 in Chimera. b Ribbon diagram of the atomic model of the quaternary complex. Integrin and TS2/16 are shown in the same color scheme as Fig. 1c. Laminin α5, β1, and γ1 chains are shown in light green, blue, and yellow, respectively. VH-SARAH and VL-SARAH of HUTS-4 Fv-clasp are shown in orange and purple, respectively.

