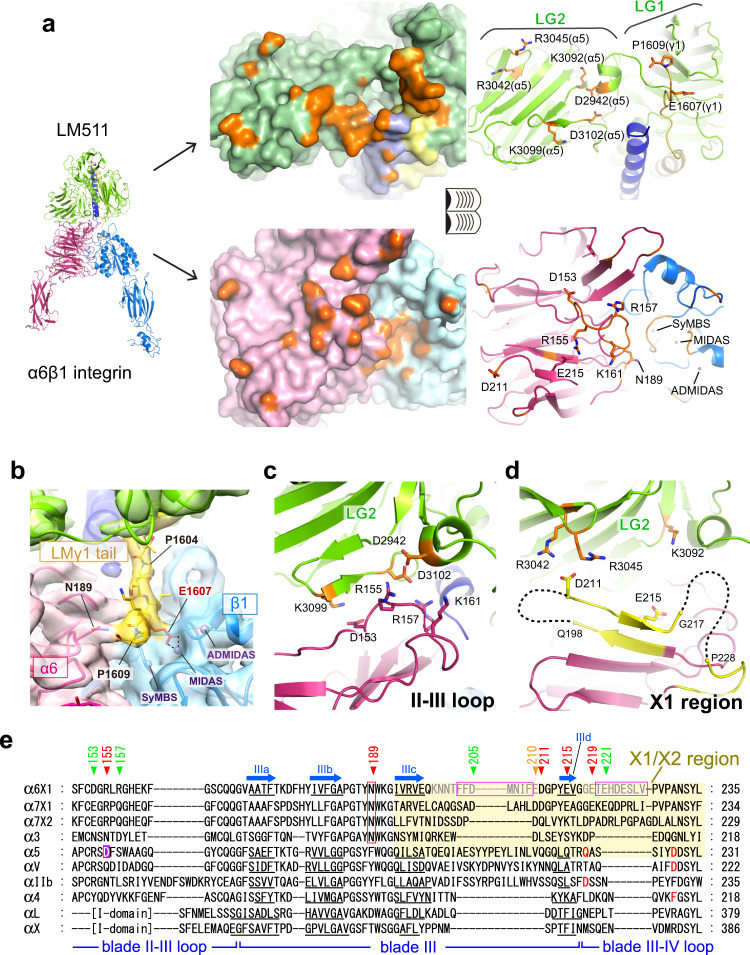
Fig. 5. Interaction between α6β1 integrin and LM511.
a Open book view of the binding interface. (Left) Surface representations. Atoms in contact with the partner molecule (within 4 Å) are shown in orange. (Right) Cartoon representations. The key residues in this paper are shown as stick models and labeled. The surface and the cartoon figures are viewed from the same orientation. b Cryo-EM map near the laminin γ1-tail, drawn at the contour level of 0.05 in Chimera. The atomic model of the γ1-tail region (T1603-P1609) is shown in yellow stick model. Note that E1607 (red stick model) in the γ1-tail is in a suitable position to coordinate MIDAS cation and that the terminal carboxyl group of P1609 is pointing toward N189 of integrin α6 subunit. Close-up views for the contacts between the laminin LG2 domain and the II-III loop region c or the X1 region d of the α6 β-propeller domain. e Multiple sequence alignment of integrin α subunits for blade III and its flanking loop regions. Positions for the four β-strands constituting the blade III (strands IIIa-IIId) are denoted by blue arrows above the alignment, and the actual β-strand segments in each structurally determined α subunit are underlined. The Asn189 conserved in all laminin-binding integrins and the segments that are truncated in α6 mutants used in Fig. 6f are boxed in red and magenta, respectively. The α6 residues mutated for the functional study shown in Fig. 6 are labeled on top of the alignment, color-coded according to their fold reduction in the laminin affinity when mutated to Ala by red (>10-fold), orange (5–10 fold), and green (<5-fold). See also Fig. 6g.

