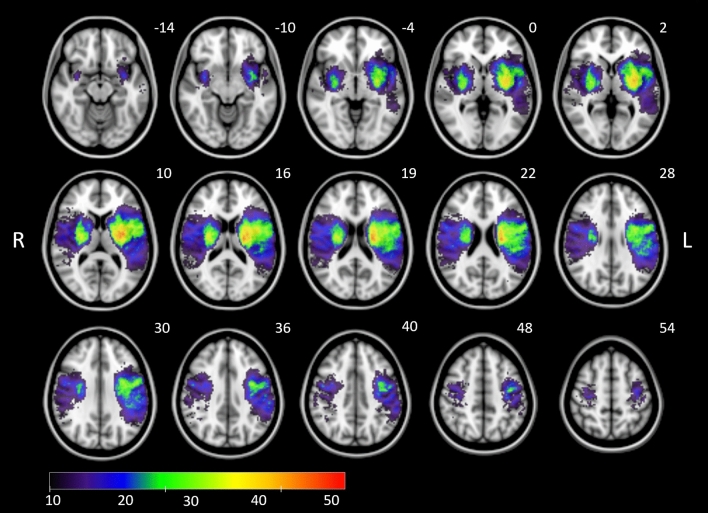
Figure 2.
Overlay lesion plot of stroke lesions from all patients (n = 329) in radiological convention mapped onto the Montreal Neurological Institute (MNI) template. Overlays are thresholded to show lesions present in at least 10 individuals as included in the lesion-symptom mapping analysis. The color bar indicates lesion frequency across all patients. MNI coordinates of each transverse section (z axis) are indicated in white numbers above the slices.

