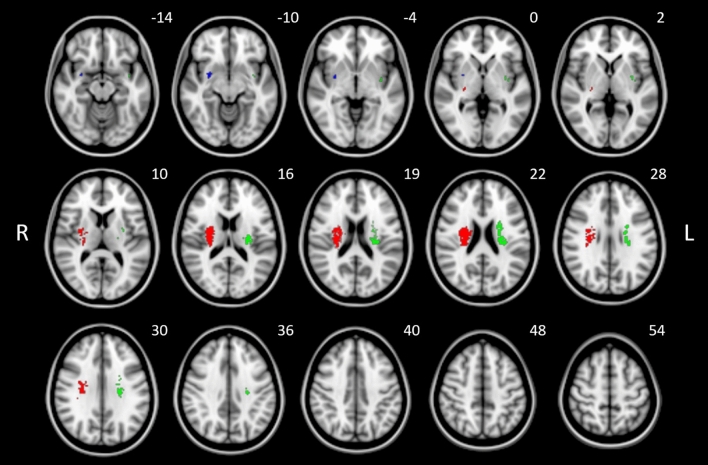
Figure 3.
Results of SVR lesion-symptom mapping for the EQ-5D sum scores illustrated on a brain template in MNI standard space oriented in radiological convention. Three clusters with N > 50 significant voxels after permutation based on a threshold of p < 0.005 are shown. Clusters are color-coded to identify p-values after cluster-wise FWE correction (p = 0.036 [red]; p = 0.062 [green]; p = 0.298 [blue]). See also Table 1 for statistical and anatomical details. MNI coordinates of each transverse section (z axis) are shown.

