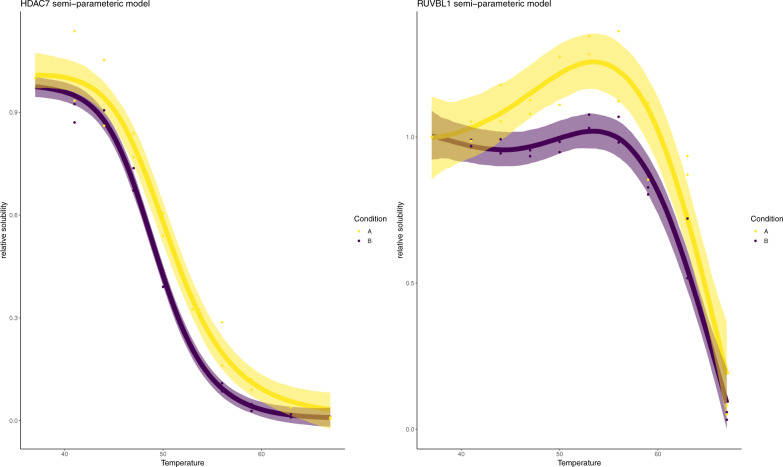
Fig. 4. Example model fits using semi-parametric model.
Melting profiles for HDAC 7 and RUVBL1 using the Bayesian semi-parametric model. The points are observed protein data. The line represents the inferred mean function and the shaded region is the 95% credible band for the inferred mean function. Purple denotes the drug treated context, whilst yellow denotes the control. Statistics derived from two biological replicates, for each of two conditions each with 10 measure temperatures.

