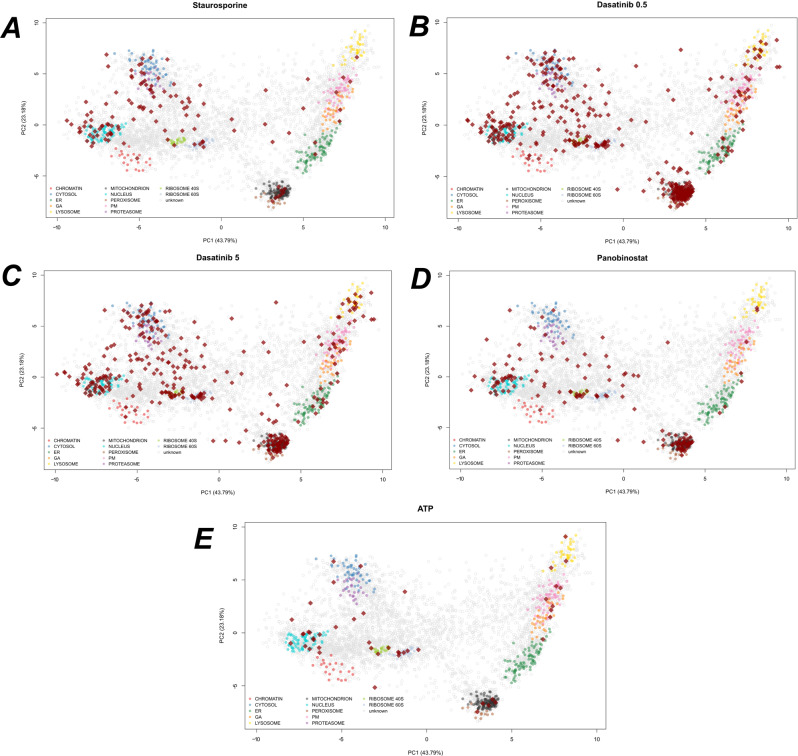
Fig. 6. Subcellular localisations of proteins deviating from sigmoid behaviour.
A–E PCA plots of U-2 OS hyperLOPIT data95, showing the top two principal components. Each pointer is a protein and marker proteins for each subcellular niche are coloured. Dark red diamonds denote proteins that were deemed to have non-sigmoid behaviour from TPP data. Each panel represents a different TPP dataset for the projected proteins. HyperLOPIT experiments are from biological triplicates with using a total of 57 fractions.

