Figure 4.
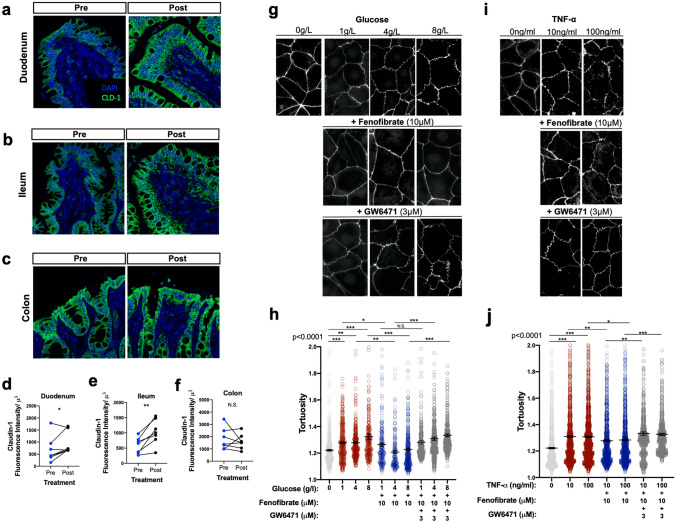
Fenofibrate upregulates expression of tight junctions on intestinal epithelial cells. Immunofluorescent staining of claudin-1 (CLD-1) expression in the (a) duodenum, (b) ileum, and (c) colon of diabetic dogs pre- and post-fenofibrate administration. (d–f) Semi-quantitation of CLD-1 protein expression in the intestinal compartments. (g) Representative ZO-1 staining and (h) quantification of barrier tortuosity in Caco-2 cells treated with different concentrations of glucose + 10 μM fenofibrate + 3 μM GW6741 or (i, j) TNF-α + fenofibrate + GW6741 for 24 h. *P < 0.05, **P < 0.01, ***P < 0.001 by (a–f) mixed models ANOVA and (g–j) one-way ANOVA with Tukey’s multiple comparison test. N.S., not significant.

