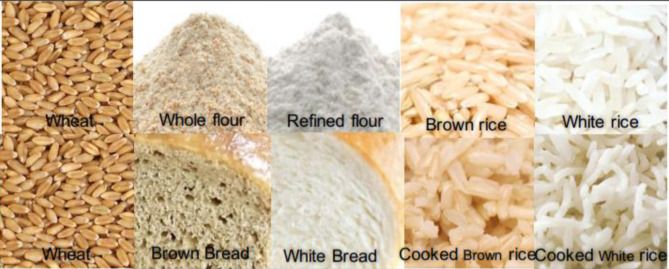
Table 2.
Vitamin content (mg/100 g) and % RDA of cooked whole and refined cereals.
 | |||||||||
|---|---|---|---|---|---|---|---|---|---|
| Vitamin content (mg per 100 g) | RDA (mg) | Bread (brown) | % RDA | Bread (white) | % RDA | Rice (brown) | % RDA | Rice (white) | % RDA |
| B1 | 1.2 | 0.21b | 18 | 0.1b | 8 | 0.178 | 15 | 0.02 | 2 |
| B2 | 1.3 | 0.16b | 12 | 0.11b | 8 | 0.069 | 5 | 0.013 | 1 |
| B3 | 16 | 3.8c | 24 | 1.6c | 10 | 2.561 | 16 | 0.4 | 3 |
| B5 | 5 | 0.65 | 13 | 0.46 | 9 | 0.38 | 8 | 0.15 | 3 |
| B6 | 1.3 | 0.14b | 11 | 0.017b | 1 | 0.123 | 9 | 0.093 | 7 |
| B9 | 0.4 | 0.04a | 10 | 0.025a | 6 | 0.009 | 2 | 0.003 | 1 |
| E | 15 | 2.66 | 18 | 0.38 | 3 | 0.17 | 1 | 0.04 | 0 |
| K | 0.12 | 0.008 | 7 | 0.008 | 6 | 0.0002 | 0 | 0 | 0 |
