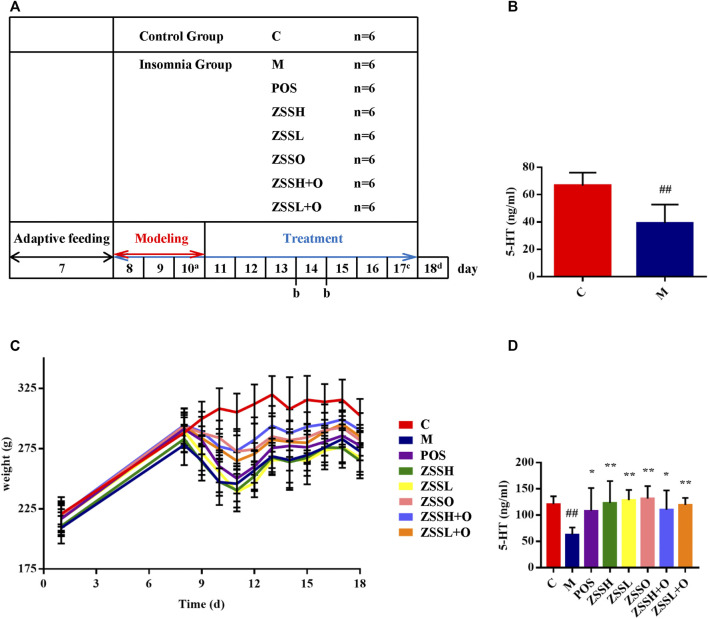
FIGURE 1.
A schematic diagram for the time design of experiment (A). a: Collecting C and M group plasma for model verification; b: Fasting for 12 h and collecting 12 h urine; c: Collecting fresh feces for 16S rRNA gene sequencing; d: Fasting for 12 h and collecting plasma. Determination of 5-HT among the C and M groups after modeling (B). Weight changes during the experiment (C). Determination of 5-HT after experiment (D). (C) control group; (M) model group; (POS) positive group; (ZSSH) high-dose ZSS ethanol extract group; (ZSSL) low-dose ZSS ethanol extract group; (ZSSO) ZSS oil extract group; (ZSSH + O) high-dose ZSS ethanol + oil extract group; (ZSSL + O) low-dose ZSS ethanol + oil extract group. Values are presented as the mean ± SD, n = 6. #p < 0.05, ##p < 0.01: model vs control; *p < 0.05, **p < 0.01: treatment vs model.

