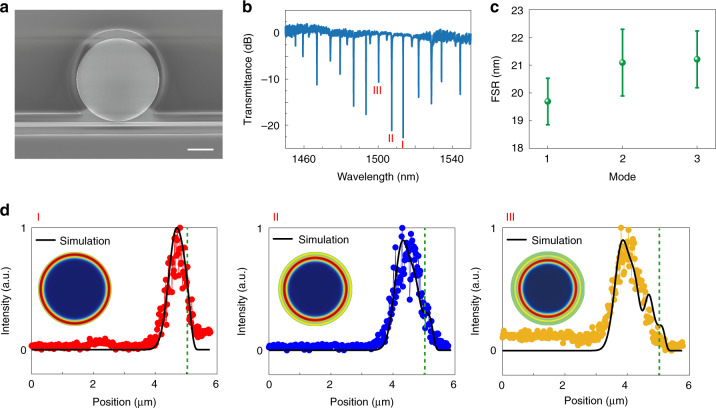
Fig. 2. Validation of the proposed method in a circular microdisk.
a. Top-view SEM image of a silicon microdisk. The radius of the microdisk is 5 µm, the widths of the bus waveguide and the gap are 458 nm and 80 nm, respectively. The scale bar is 3 µm. b. Experimentally recorded transmission spectrum along the bus waveguide. c. Average FSR of three sets of resonances in the silicon microdisk. d. Experimentally recorded field distributions of resonances I, II, III in Fig. 2b. Here only the intensity along the radius is considered due to the rotational symmetry. Scan along the horizontal axis, starting from the center of the cavity to the right edge. The numerically calculated field distributions after taking the 600 nm laser spot size into account are shown as solid lines for a direct comparison. The insets are the corresponding numerically calculated traveling wave field patterns

