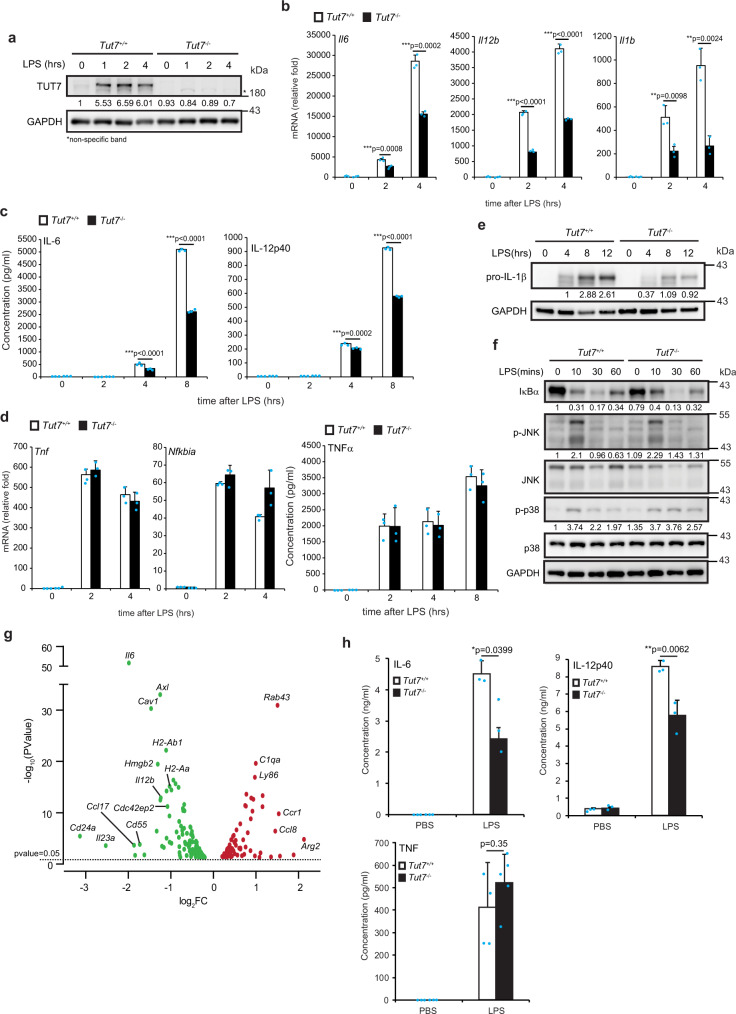
Fig. 1. TUT7 deficiency alters gene expression profile in BMDM response to LPS.
a–f BMDMs from wild-type (Tut7+/+) and Tut7−/− mice were incubated with 100 ng/ml LPS for indicated times. TUT7 protein expression was analyzed by immunoblotting (a). Il6, Il12b, and Il1b mRNA expression was determined by RT-qPCR (b, d). The levels of indicated inflammatory cytokines in cultural media were analyzed by ELISA (c, d). The levels of pro-IL-1β, IκBα, and phosphorylation of MAP kinases were analyzed by immunoblotting (e, f). g Volcano plot of the changes of innate immune-related gene expressions in Tut7−/− BMDMs after 4 h treatment with 100 ng/ml LPS against wild-type BMDMs. The transcriptome of BMDMs from wild-type and Tut7−/− was compared to baseline. The x-axis indicates the logarithm of p values to the base 2 of the fold-change (FC) and the y-axis reveals the negative logarithm of that to the base 10. Black horizontal dash line indicates significance at 5% criteria (p value = 0.05). log2FC > +0.2 and log2FC < −0.2 indicate increase of transcript levels by >20% and decreased by >20%, respectively. Green and red dots denote transcripts related to innate immune responses that were significantly lower (n = 111) and higher (n = 68) in response to LPS, respectively. The innate immune-related genes that are significantly differentially expressed are listed in Supplementary Tables 2, 3. h 8-week-old mice were injected intraperitoneally with LPS (50 μg/kg). Whole blood was collected 2 h after LPS challenge, and the concentrations of IL-6, IL-12p40, and TNF in sera were determined by ELISA. Data (except g) presented are representative of three independent experiments with triplicates in each experiment (error bars, mean ± S.D.). The p values were obtained from two-tailed Student’s t test and are shown in the figure if p < 0.05. Source data are provided as a Source Data file.

