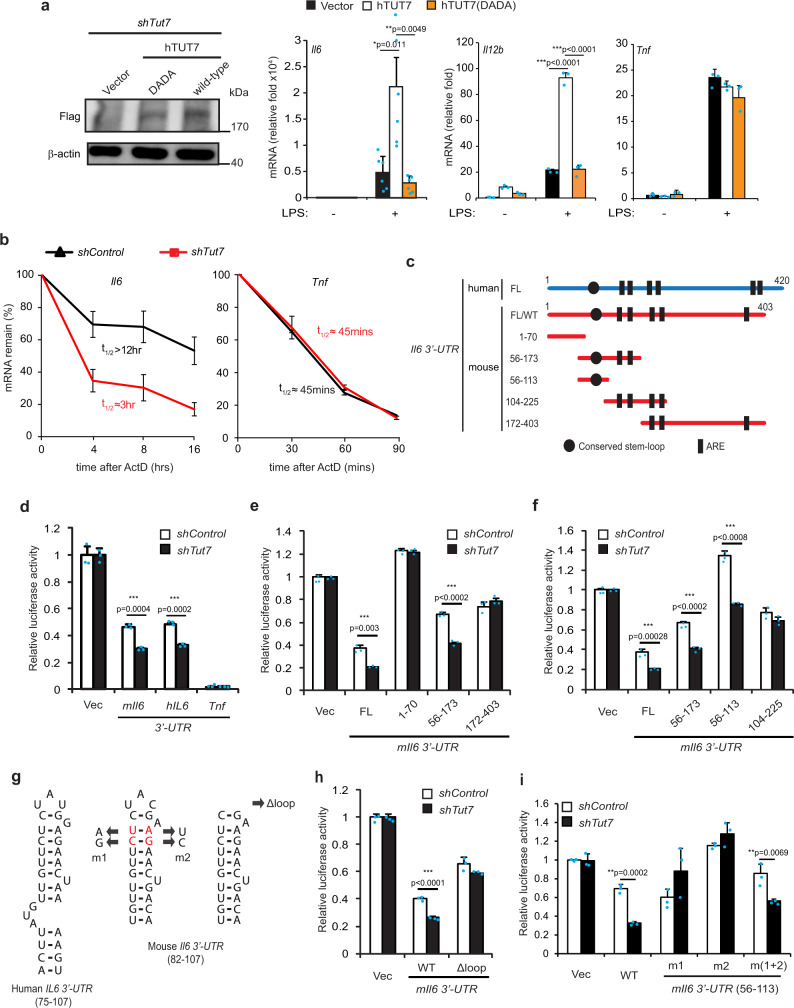
Fig. 2. Regulation of Il6 mRNA stability by TUT7 is dependent on its 3′-UTR56-104.
a Tut7-silenced RAW 264.7 macrophages were reconstituted with either flag-tagged human wild-type TUT7 (hTUT7) or activity-dead TUT7 (hTUT7(DADA)) and challenged with 100 ng/ml LPS for 4 h. The expression of IL-6, IL-12p40, and TNF mRNAs and TUT7 protein were analyzed by RT-qPCR and immunoblotting, respectively. b RAW 264.7 macrophages expressing shControl and shTut7 were treated with 100 ng/ml LPS for 4 h followed by incubation with 5 μg/ml actinomycin D for the indicated times. Total RNAs were extracted and analyzed by RT-qPCR. c Schematic diagram of the firefly luciferase reporter constructs containing full-length (FL) and truncated forms of mouse (red line) or human (blue line) Il6 3′-UTR. d–f Control and Tut7-depleted RAW 264.7 cells were co-transfected with the indicated firefly luciferase reporter plasmids containing various mouse or human Il6 3′-UTR (mIl6 3′-UTR or hIL6 3′-UTR) or Tnf 3′-UTR and TK-renilla control reporter plasmid. At 48 h post-transfection, cells were treated with 100 ng/ml LPS for 8 h and the luciferase activities were determined. g Schematic diagram of the predicted stem-loop structure in human and mouse Il6 3′-UTR, and mutants whose stem-loop structure (m1 and m2) or loop structure (Δloop) were disrupted or deleted. The stem-loop structure of mIl6 3′-UTR or hIL6 3′-UTR was predicted by ref. 14. Mutant m(1 + 2) was generated to swap sequences on the 5′ and 3′ sides of the stems without disrupting the stem-loop structure in mIl6 3′-UTR. h, i Control and shTut7-expressing RAW 264.7 cells were co-transfected with the indicated luciferase reporter plasmids and TK-renilla control reporter plasmid for 48 h. Cells were stimulated with 100 ng/ml LPS for 8 h and harvested for the analysis of luciferase activity. Data presented are representative of three independent experiments with triplicates in each experiment (error bars, mean ± S.D.). The p values were obtained from two-tailed Student’s t test and are shown in the figure if p < 0.05. Source data are provided as a Source Data file.

