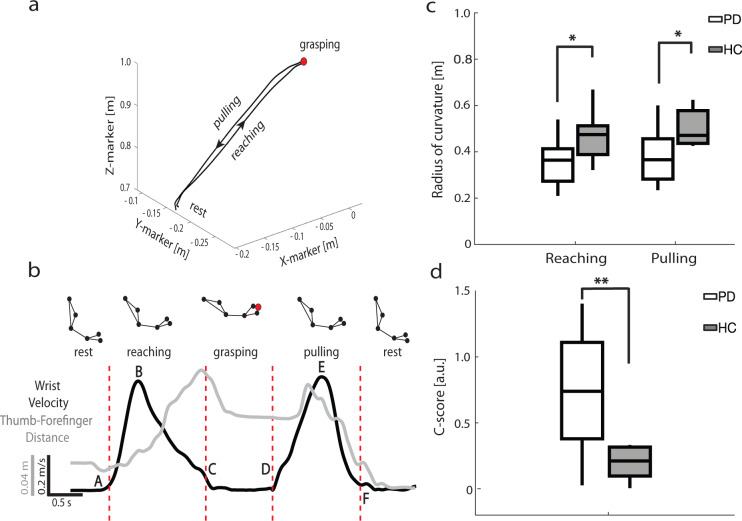
Fig. 1. Kinematics measurements of parkinsonian patients (PD) and healthy controls (HC).
a Example of the trajectory of one reach-to-grasp trial for patient wue02. The black arrows indicate the direction of the movement from the start of the reaching phase to the end of the pulling phase. X-marker: anterior–posterior coordinate of the marker; Y-marker: medio-lateral coordinate of the marker; Z-marker: vertical coordinate of the marker. b Task phases identification for patient wue02. Reach-to-grasp phases were defined according to the wrist marker absolute velocity profile (black line). The thumb-forefinger distance is plotted in gray. The letters A–F indicate the relevant timestamps during the reach-to-grasp task: A, movement onset; B, velocity peak of the reaching phase; C, approach to target; D, movement onset; E, velocity peak of the pulling phase; F, comeback to start position. The red dashed vertical lines identify the phases. Markers were placed on the acromion, the bicep muscle, the lateral epicondyle of the humerus, the ulnar styloid, the distal phalange dorsal head of the index, and the tip of the thumb. See also Supplementary Fig. 1. c Radius of the curvature during the reaching and pulling phases. d Coordination C-score. Boxplots are drawn between the 25th and the 75th percentiles, with a horizontal line indicating the median. The whiskers extended above and below to the most extreme data points within 1.5 times the interquartile range. Asterisks denote the statistical significance *p < 0.05, **p < 0.01, and ***p < 0.001 of the Mann–Whitney U-test. See also Supplementary Figs. 1–4.

