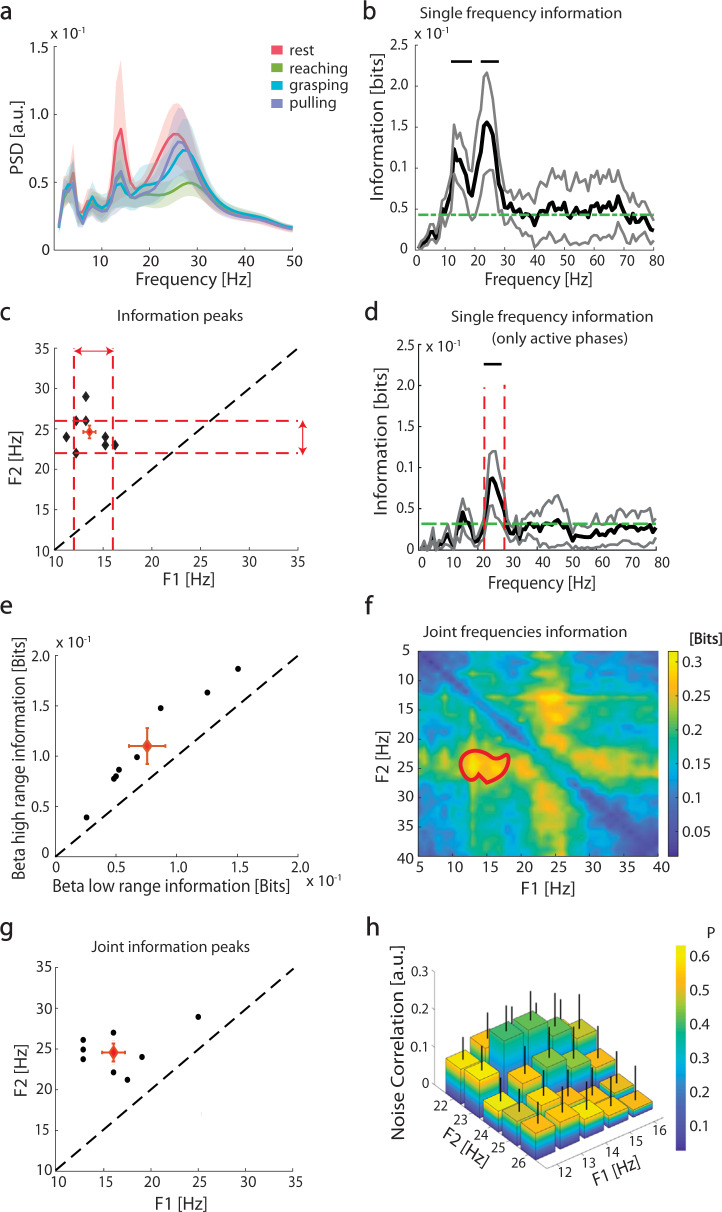
Fig. 2. Subthalamic nucleus local field potential (LFP) spectral information about reach-to-grasp phases.
a Group average subthalamic power spectral density (PSD) during the reach-to-grasp task. The shaded regions represent the standard errors of the means (SEM). b Group average frequency-wise spectral information of task phases carried by LFP power (black line). The gray lines represent SEM. The green dashed line is the significance threshold. Black horizontal upper lines denote the range of frequencies with a significant amount of information carried by the LFP power according the permutation test (PT). (p < 0.05, false discovery rate (FDR) correction). c Frequency location of the two peaks in spectral information for each subject (black diamonds). The red diamond is the centroid of the 2D distribution, with red bars representing the standard error of the centroid along the two dimensions. Red dashed lines indicate the ranges selected for the subsequent analyses: beta low range (horizontal red double-sided arrow, 14 ± 2 Hz) and beta high range (vertical red double-sided arrow, 24 ± 2 Hz). Black dashed line indicates identity. d Same as b, but with mutual information between single frequency power and the set of active movement phases (reaching grasping pulling), not including rest. Inset reports mutual information between this set of movement phases and the overall high beta power and low beta power. Only the former information is significant (p < 0.05, bootstrap test). Vertical lines indicate high beta range boundaries as defined in c. e Information carried by beta low range (14 ± 2 Hz) and beta high range (24 ± 2 Hz) about task phases. The red diamond is the centroid of the 2D distribution, with red bars representing the standard error of the centroid along the two dimensions. Black dashed line indicates identity. f Group average of the joint spectral information about task phases. The region enclosed in the red thick curve represents the 2D interval (12–18 and 22–26 Hz) of the frequencies space with a significant amount of information (cluster-based PT, *p < 0.05). g Pairs of frequencies with maximal joint information at the single-subject level. The red diamond is the centroid of the 2D distribution, with red bars representing the standard error of the centroid along the two dimensions. Black dashed line indicates identity. h Noise correlation between pairs of frequencies for the two ranges. Color represents associated p-values and error-bar SEM across subjects. See also Supplementary Figs. 5 and 6 and Supplementary Table 3.

