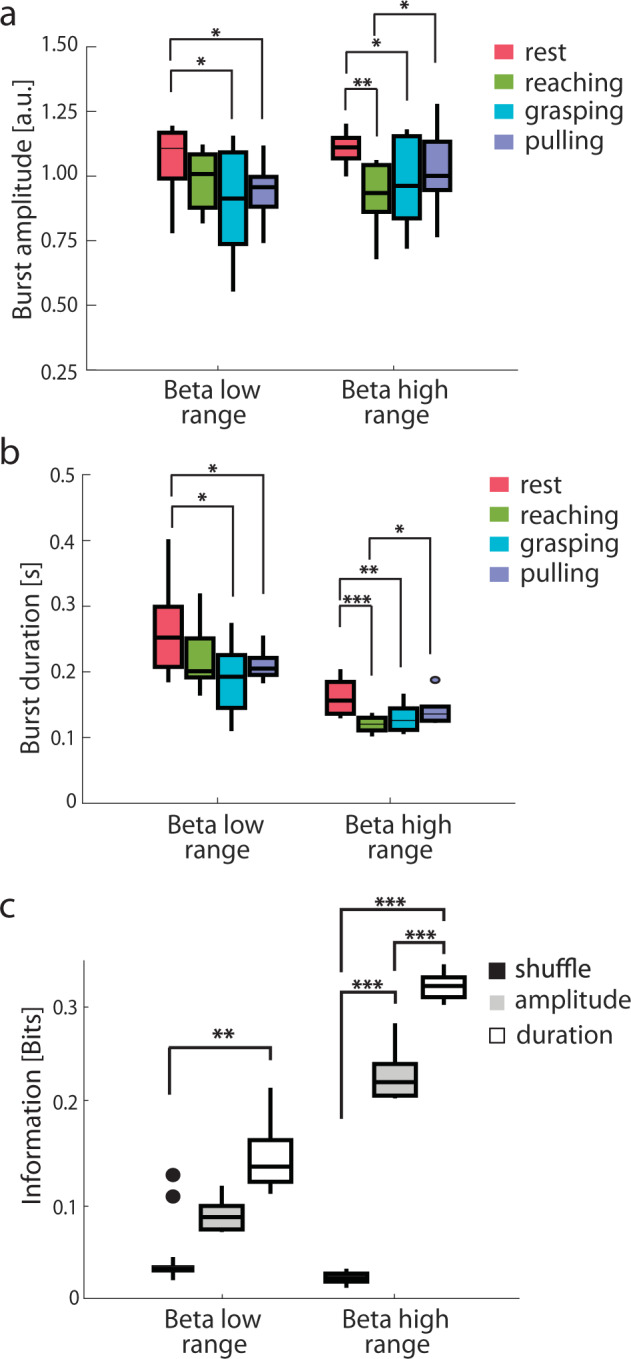
Fig. 3. Burst analysis for beta ranges selected according to information analysis.

a Group median amplitude of the bursts in beta low range (14 ± 2 Hz) and beta high range (24 ± 2 Hz) during the reach-to-grasp task. b Same as a for burst duration. c Group median information about the reach-to-grasp task carried by the amplitude (gray) and the duration (white) of the beta bursts. Information carried by a shuffle permutation (black) served for statistical significance. Boxplots are drawn between the 25th and the 75th percentiles, with a horizontal line indicating the median. The whiskers extended above and below to the most extreme data points within 1.5 times the interquartile range. Asterisks denote the statistical significance *p < 0.05, **p < 0.01, and ***p < 0.001 of the permutation test (PT). See also Supplementary Figs. 7 and 8.
