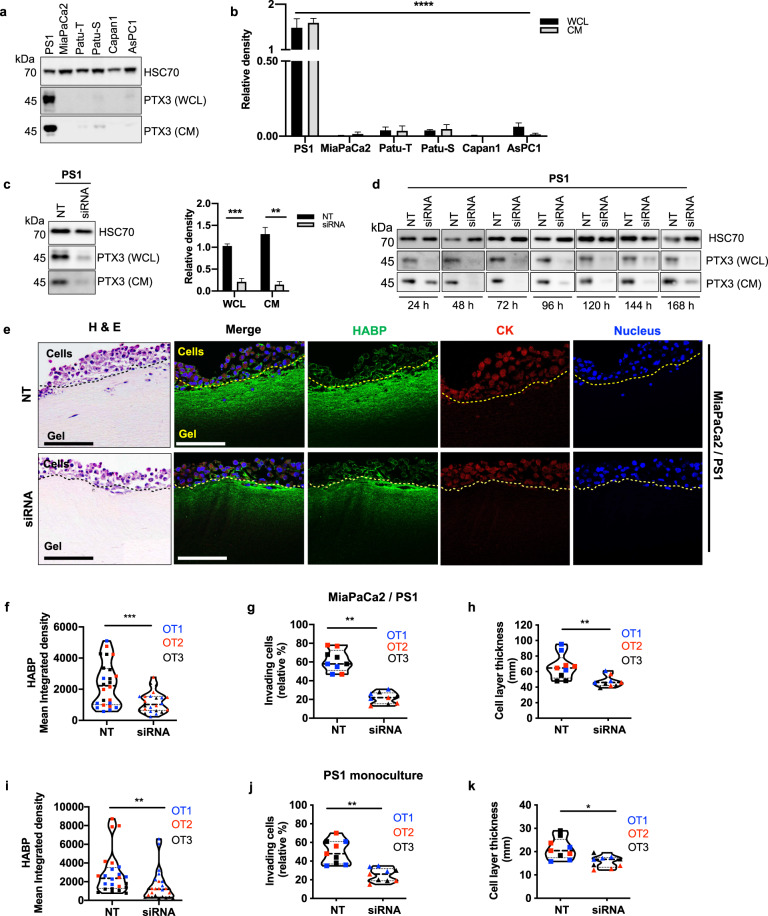
Fig. 3. Hyaluronic acid deposition is reduced upon PTX3 siRNA.
a PTX3 expression in whole cell lysates (WCL) and conditioned media (CM) of pancreatic stellate cell line (PS1), cancer cell lines (MiaPaCa2, Patu-T, Patu-S, Capan1, AsPc1) by Western blot analysis and b densitometric quantification (n = 4). HSC70 was used as a loading control. c Western blot depicting expression of PTX3 in WCL and CM of PS1 cells 72 h after transfection with 20 nM of PTX3 siRNA (siRNA) or non-targeting siRNA (NT), with HSC70 loading control and densitometric quantification (n = 3). Summary data are expressed as mean with standard error mean. d Duration of PTX3 silencing resulting from siRNA transfection was assessed. Western blot of PTX3 expression in WCL and CM of pancreatic stellate cells (PS1) from 24–168 h. e Representative H&E and immunofluorescence images of mini-organotypic cultures of cancer (MiaPaCa2) and stellate (PS1) cells transfected with PTX3 siRNA or NT siRNA, demonstrating HABP expression. Scale bar = 100 μm. Summary quantification data from mini-organotypic co-cultures of cancer (MiaPaCa2) and stellate (PS1) cells transfected with PTX3 siRNA or NT siRNA. f Quantification of HABP expression in images (n = 6, 8 images/gel). g Percentage of invading cells presented as the mean percentage relative to NT control. h Cell proliferation assessed by the measurement of the cell layer thickness. Summary quantification data from mini-organotypic monocultures of stellate (PS1) cells transfected with PTX3 siRNA or NT siRNA. i Quantification of HABP expression in images (n = 6, 8 images/gel). j Percentage of invading cells presented as the mean percentage relative to NT control. k Cell proliferation assessed by the measurement of the cell layer thickness. Sections from three experimental replicates were analyzed for mini-organotypics, resulting in 27 high-power field measurements (n = 9, 3 sections/gel). OT1, OT2, OT3: organotypic biological repeats. b Kruskal–Wallis test; WCL, CM: ****P < 0.0001, c Mann–Whitney U test, **P < 0.01,***P < 0.001, f–k Wilcoxon matched-pairs test, *P < 0.05, **P < 0.01, ***P < 0.001. Summary data are expressed as median and interquartile range.

