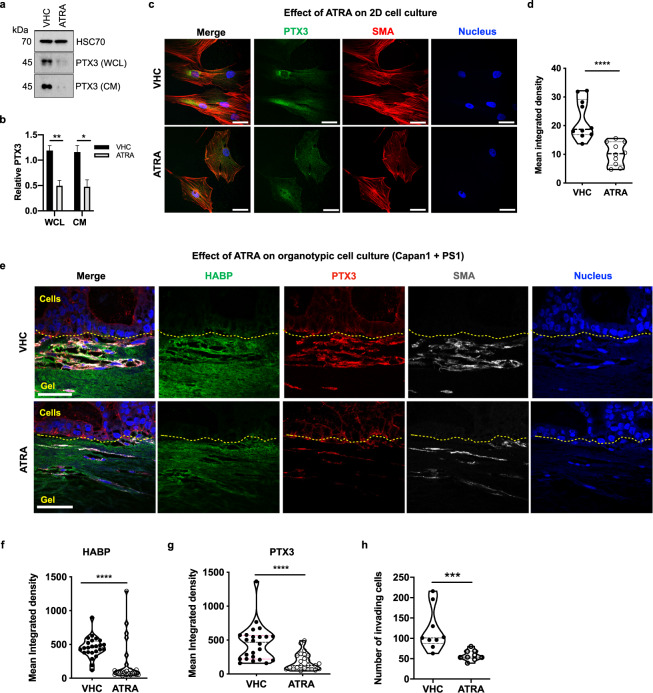
Fig. 4. Retinoic acid treatment reduces the expression of the PTX3 protein in vitro.
a Representative Western blot of PTX3 expression in WCL and CM of pancreatic stellate cells after ATRA or vehicle (VHC) treatment, with HSC70 (WCL) and Ponceau (CM, not shown) used as loading control and its b densitometric quantification (n = 4). c Representative immunofluorescence images of PS1 cells treated with ATRA or vehicle and d quantification of PTX3 expression (n = 10). e Representative immunofluorescence images of mini-organotypic cultures of Capan1 cells / PS1 treated with ATRA or vehicle and f quantification of HABP expression in images (n = 6, 8 images/gel). g quantification of PTX3 expression in images (n = 6, 8 images/gel), and h quantification of invading cells (n = 6, 3 images/gel). c, e Scale bar = 50 µm. b Unpaired t-test, summary data expressed as mean with standard error mean. d, f, g, h: Mann–Whitney U test, *P < 0.05, **P < 0.01, ****P < 0.0001. Summary data are expressed as median and interquartile range.

