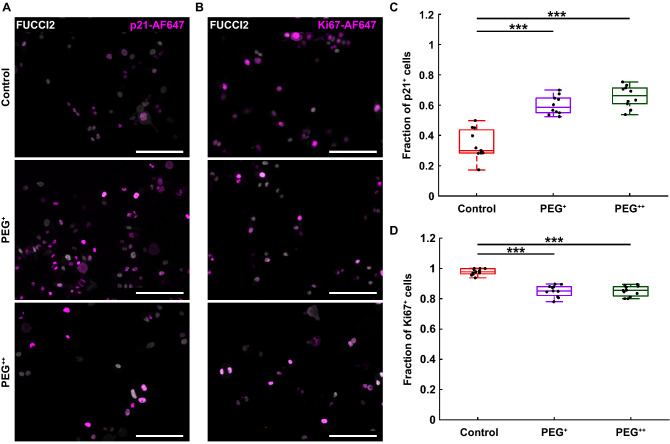
Figure 4.
Osmotically-driven delayed or growth-arrested cells show a higher expression of p21 and lower expression of the proliferation marker Ki67. (A) p21 immunofluorescence (magenta, AF647) overlaid with FUCCI2 fluorescent cells (artificially indicated as white) for the control, PEG+ and PEG++ groups, at 90 h time point. Scale bars are 200 µm. (B) Ki67 immunofluorescence (magenta, AF647) overlaid with FUCCI2 fluorescent cells (artificially indicated as white) for the control, PEG+ and PEG++ groups, at 90 h time point. Scale bars are 200 µm. (C) Fraction of p21 positive cells on three biological repeats and N = 10 wells. (D) Fraction of Ki67 positive cells on three biological repeats and N = 10 wells. The plots represent the median, 1st and 3rd quartiles and extrema. Statistical analysis with respect to the control using a two-tailed Wilcoxon rank sum test, n.s: p > 0.05, *: p < 0.05, **: p < 0.01 and ***: p < 0.001.

