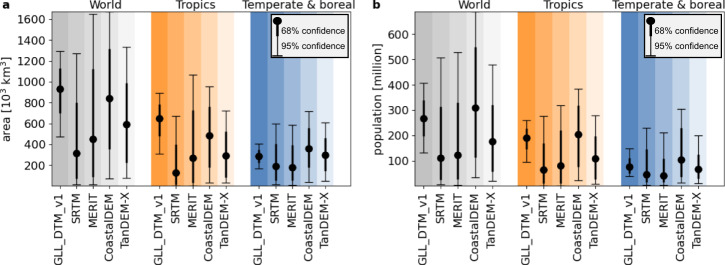
Fig. 3. Coastal lowland area and population below 2 m above mean sea level (+MSL), with confidence levels at 68 and 95%; summary of Supplementary Data.
a Areas calculated from different Global Digital Elevation Models (SRTM9013, MERIT14, CoastalDEM15 and TanDEM-X23) compared to GLL_DTM_v18 at 0.05-degree resolution, for countries ranked by land area greater than 12,000 km2 below 2 m +MSL. For consistency, numbers are calculated within the SRTM coverage extent, between 60 N and 56 S. b Population data from ref. 22.

