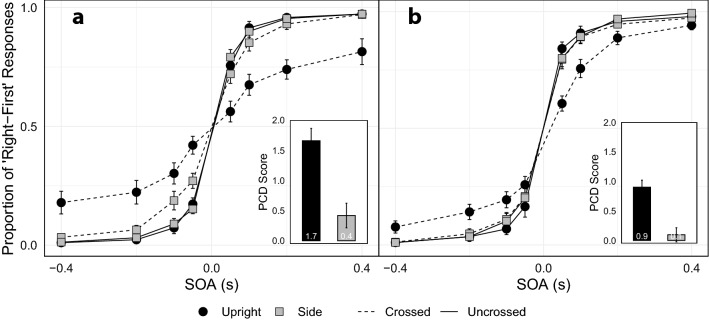
Figure 2.
Overall proportion of right-first responses while wearing (a) no blindfold and (b) a blindfold. Participants indicated which hand was vibrated first, and the average proportion of ‘right-first’ responses was calculated at each SOA. Negative SOAs indicate the left hand received the vibration first. The average PCD score for each condition is represented in the bar graphs. Error bars represent standard error of the mean corrected for a within-subject design15,16.

