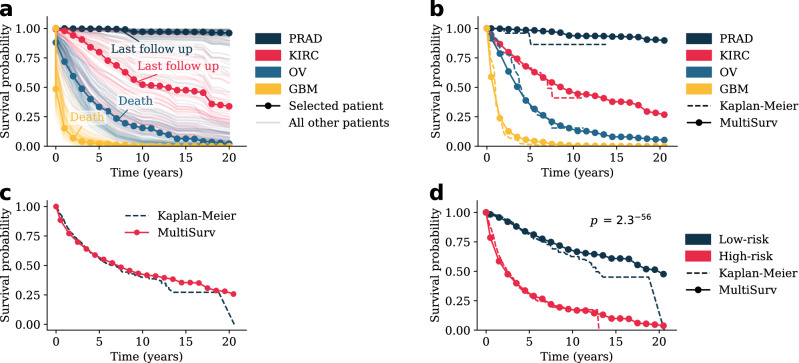
Figure 2.
MultiSurv predictions allow construction of accurate survival curves. MultiSurv outputs patient survival predictions for the defined discrete-time follow up intervals. These can then be averaged to obtain group-wide survival predictions. (a) Survival curves constructed using Multisurv predictions for each patient in the test dataset diagnosed with one of four selected cancer types. One example patient is highlighted for each cancer type and the corresponding last follow up time point is annotated (as “Last follow up” if the patient is censored or “Death” if it corresponds to patient death). Highlighted patient codes are TCGA-HI-7169 for PRAD, TCGA-B0-5691 for KIRC, TCGA-29-1762 for OV, and TCGA-19-1390 for GBM. (b) Survival curves for the four example cancer types in (a) compared with Kaplan–Meier estimator outputs. (c) Survival curves for all patients in the test dataset compared with the Kaplan–Meier estimator output. (d) MultiSurv predictions allow accurate stratification of patient risk groups. Patients were split into low and high-risk groups according to MultiSurv’s first output interval risk prediction using the median value across all patients as the threshold. The two resulting groups have significantly different Kaplan–Meier estimates (log-rank test). The plot shows MultiSurv prediction averages overlayed on the Kaplan–Meier estimators. PRAD prostate adenocarcinoma, KIRC kidney renal clear cell carcinoma, OV ovarian serous cystadenocarcinoma, GBM glioblastoma multiforme.

