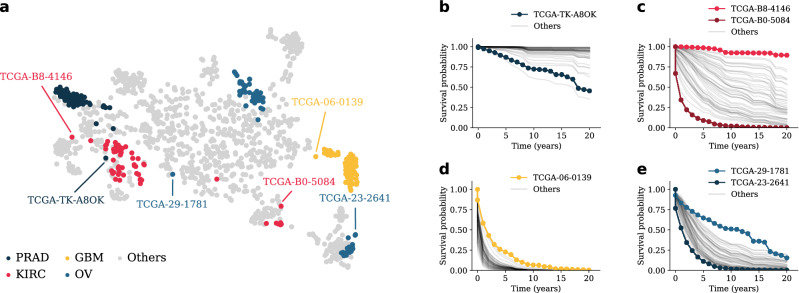
Figure 3.
Visualization of feature representations learned by MultiSurv. We collected the internal fused feature representation vector of the MultiSurv model trained on clinical and mRNA data and embedded it into a two-dimensional space using t-SNE. (a) Embedded feature representations for each patient in the test dataset. Patients diagnosed with each of four selected cancer types are highlighted. Within each of the highlighted cancer types, visually selected outlier patients are annotated. All patient survival curves, highlighting the selected outliers, are displayed for (b) PRAD, (c) KIRC, (d) GBM, and (e) OV. PRAD prostate adenocarcinoma, KIRC kidney renal clear cell carcinoma, OV ovarian serous cystadenocarcinoma, GBM glioblastoma multiforme.

