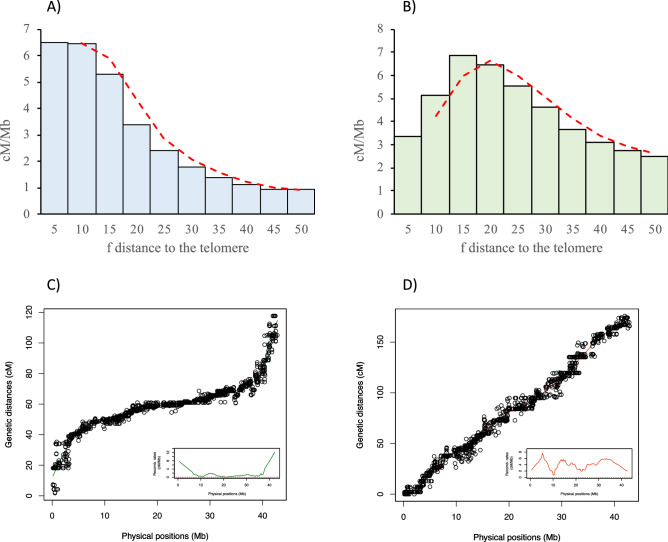
Figure 5.
Recombination landscape averaged across linkage groups for (A) male and (B) female. The recombination rates (cM/Mb) and the relative distance from the nearest telomere scaled by the chromosome length (f) is represented. The red dashed line indicates the observed tendency. Panels (C,D) show the relationship between physical and genetic distances for SseLG1 in male and female, respectively. The square inside the panels (C,D) show the specific recombination landscape. The complete information for all SseLGs is shown in Supplementary Fig. S2 and S3.

