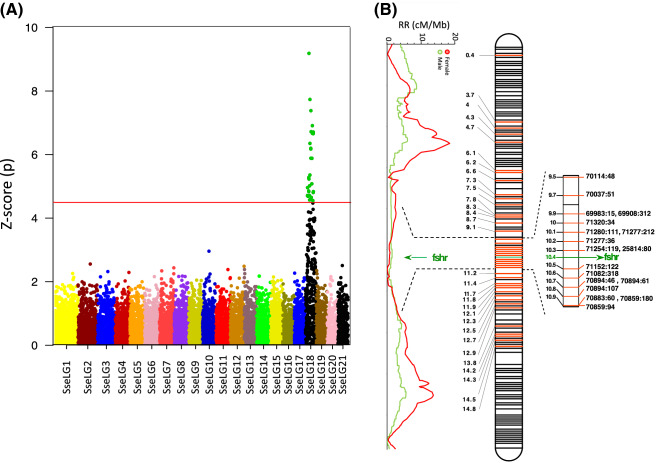
Figure 6.
Sex-associated SNPs and RR landscape for males and females in SseLG18. (A) Manhattan plot of GWAS results for sex-associated SNPs using seven families. Significant markers are indicated in green. The horizontal red line represents the Bonferroni significance threshold. (B) Distribution of all 66 sex-associated significant markers using seven families and by family (in red, Supplementary Table S5) and RR (cM/Mb) landscape of males and females. A hot region from 9.5 to 10.9 Mb containing the candidate gene fshr is indicated on the right side. Physical positions of SseLG18 in Mb are indicated in black. Black lines indicate non-significant markers in SseLG18.

