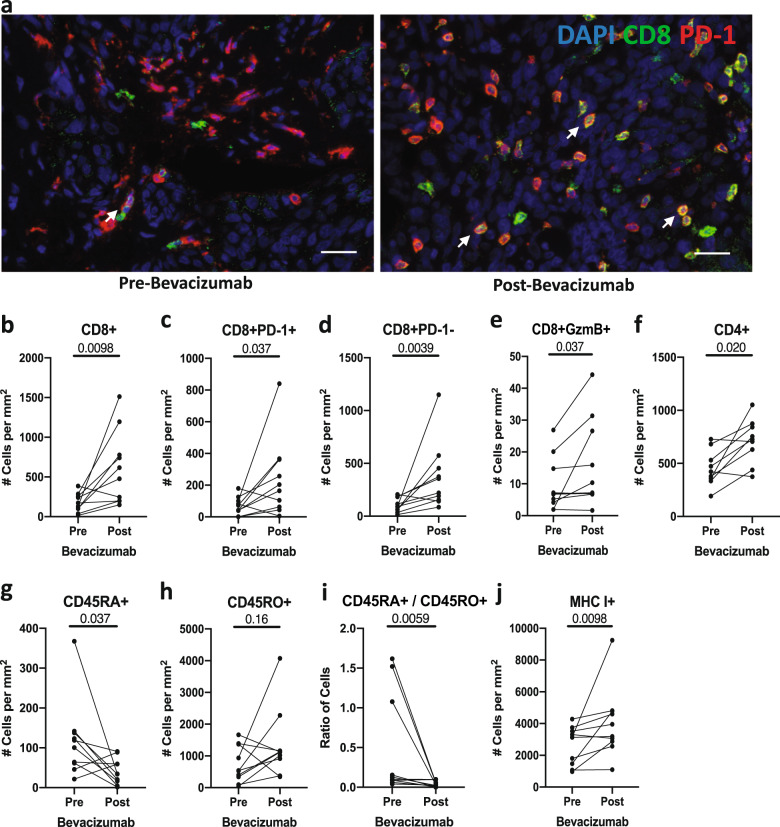
Fig. 2. Bevacizumab increased the CD8+ and CD4+ T-cell density and MHC-I expression.
a Representative multiplex immunofluorescence for CD8 and PD-1 pre- and post-bevacizumab (images from paired samples of the same patient). CD8+PD-1+ T cells (white arrows); scale bar = 50 µm. b–f Quantitative analyses of overall CD8+ (b), CD8+PD-1+ (c), CD8+PD-1− (d), CD8+GzmB+ (e), and CD4+ T cells (f). g–j Quantitative analyses of CD45RA+ (g) and CD45RO+ (h) T-cells, CD45RA+/CD45RO+ ratio (i), and MHC-I+ cells (j).

