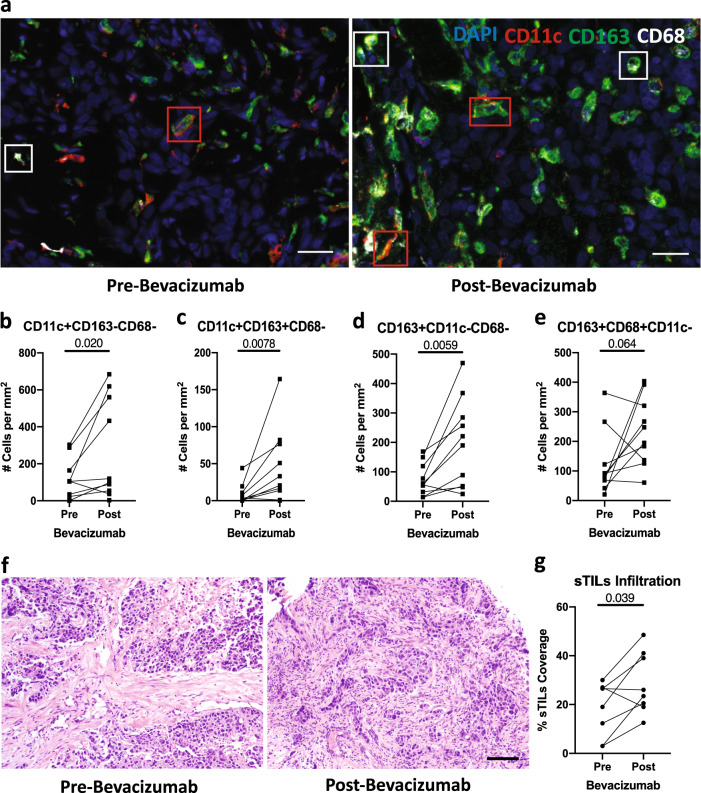
Fig. 3. Bevacizumab increased CD11c+CD163−CD68− and CD11c+CD163+CD68− DC density.
a Representative multiplex immunofluorescence for CD11c, CD163, and CD68 in TNBC pre- and post-bevacizumab (images from paired samples of the same patient); scale bar = 50 μm. Red boxes identify CD11c+CD163+CD68− DCs, white boxes identify CD163+CD68+CD11c− TAMs. b–e Quantitative analyses of CD11c+CD163−CD68− (b), CD11c+CD163+CD68− (c), CD163+CD11c−CD68− (d), and CD163+CD68+CD11c− (e) cells. f H&E image of sTILS pre- and post-bevacizumab (images from paired samples of the same patient); scale bar = 100 µm. g Quantitative analysis of sTILs.

