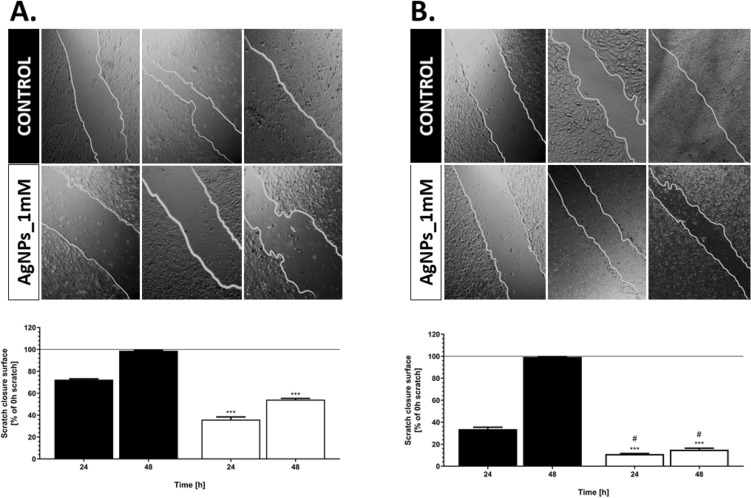
Figure 9.
Cell migration ability in response to AgNPs. Comparison of migration in both HaCaT (A) and U-2OS (B) cell lines by taking images at different time intervals (0, 24, 48 h). Results are represented by marking the scratch with parallel lines and visually displaying the number of cells migrated in to the scratch area. The widths were measured using Image J software, and the data were analyzed using Prism 5.0. The values are the means with standard deviation (error bars). The statistical significance is indicated as follows: *P < 0.05, **P < 0.01, ***P < 0.005 according to one-way ANOVA, Tukey test (compared to respective control), and #P < 0.05 are statistically different from respectively tested group (HaCaT vs. U-2OS).

