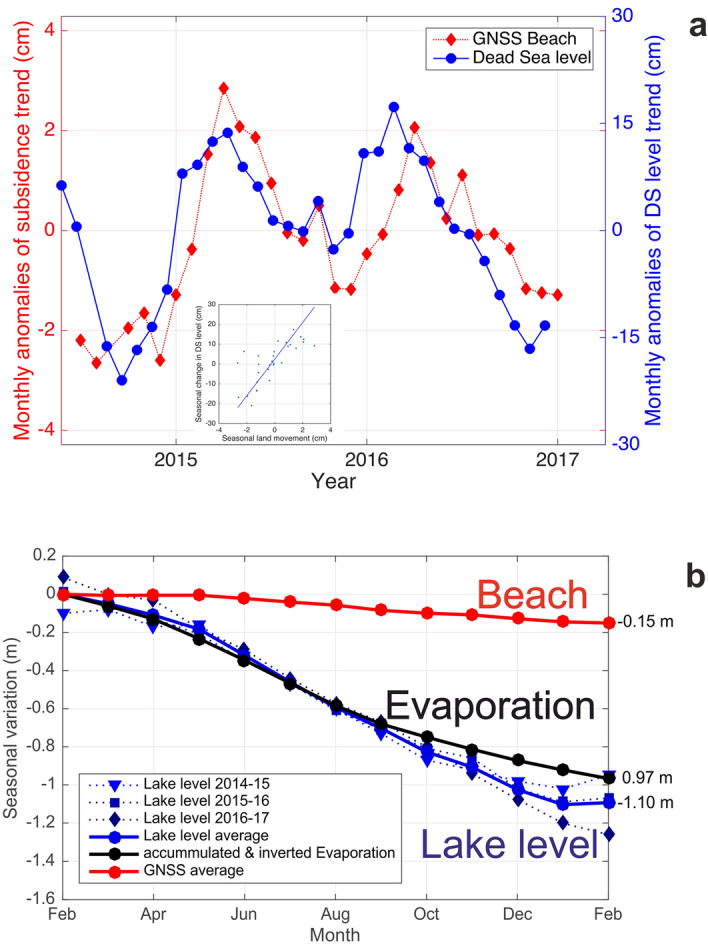
Figure 4.

(a) Monthly anomalies of the subsidence of the Beach station (red, from GNSS) and of the drop of the lake level of the DS (blue, gauge) from June 2014 to March 2017, after removal of their respective 3-year trends (− 15.3 cm/year and − 110 cm/year). The standard error for the subsidence anomalies is ± 1.1 cm and for the lake level anomalies is ± 2.7 cm. (Insert) Correlation between the two time series after backward shifting of the subsidence time series by 2 months, with a correlation coefficient of 0.84 (see also Supplementary Fig. S_3). (b) Absolute values for Beach subsidence (red), lake level drop (blue) and evaporation (black), respectively, for three 12-month periods from February to February (2014/2015, 2015/2016, 2016/2017). The solid lines depict the respective average over the three years; the dashed lines are the values for the single years. The winter 2014/2015 was wet (see Supplementary Fig. S_6) and that of 2016/2017 was dry, both visible in higher or lower lake level values, respectively. The values for the cumulative evaporation are based on Ref.10. The scaling factor between Beach (land) and the DS lake level is 7.2; i.e. − 100 cm DS lake level decrease corresponds to − 13.9 cm sinking of the beach.
