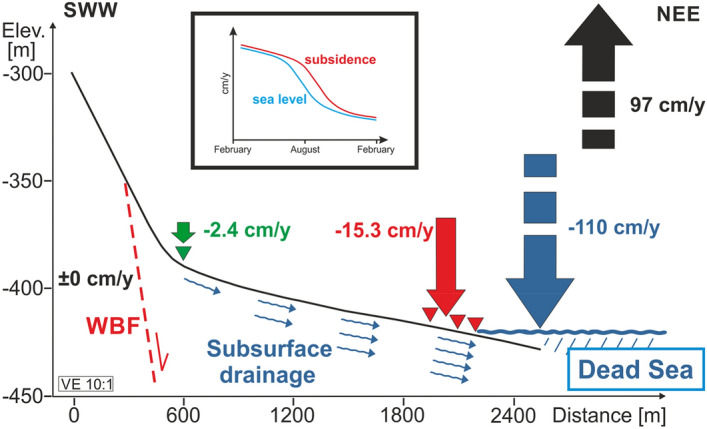
Figure 5.

Sketch of the average yearly subsidence across the red profile shown in Fig. 1, from June 2014 to March 2017. The green and red triangles are the location of the GNSS stations. Green and red arrows indicate the subsidence of the surface. The area west of the WBF (Western Boundary Fault, dashed red line) shows no vertical movement (see Supplementary Figs. S_4 and S_5), whereas the subsidence increases from − 2.4 cm/year near the SPA to − 15.3 cm/year at the Beach. The main cause of the massive subsidence observed is the drainage of the sediments below the stable salt crust, due to the drop of the DS water table. Water and its movement are labeled in blue. The average drop of the DS lake level is 110 cm/year. Vertical exaggeration is 10:1. The insert is a sketch showing in a generalized way the intra-annual dynamics of DS lake level (blue) and the delayed subsidence (red) (winter to summer to winter).
