Figure 1.
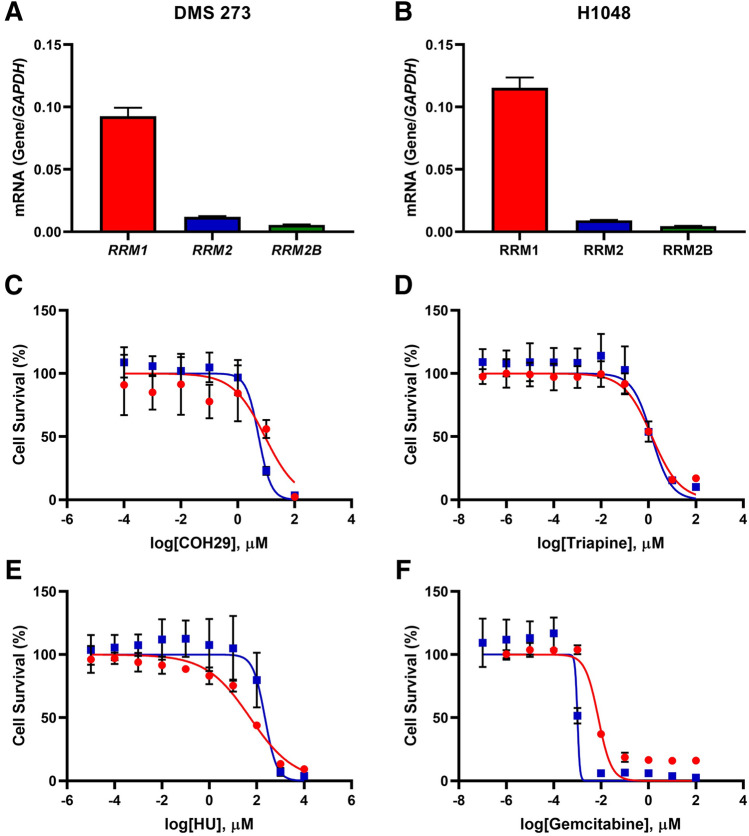
RRM1 expression and sensitivity to RRM1 inhibitors. A and B, mRNA expression of RNR-related genes in DMS 273 (A) and NCI-H1048 (B) cells. RRM1 (red), RRM2 (blue), and RRM2B (green) levels were normalized to glyceraldehyde 3‐phosphate dehydrogenase (GAPDH) expression. Data represent the mean ± standard deviation (SD; n = 3). (C–F), WST-8 assay with the RRM1 inhibitors COH29 (C), triapine (D), hydroxyurea (E), and gemcitabine (F). Cells were treated with the indicated inhibitors for 3 days and their viability was assessed using the WST-8 assay. Red circle: DMS 273, blue square: H1048. Data represent the mean ± SD (n = 6–10).

