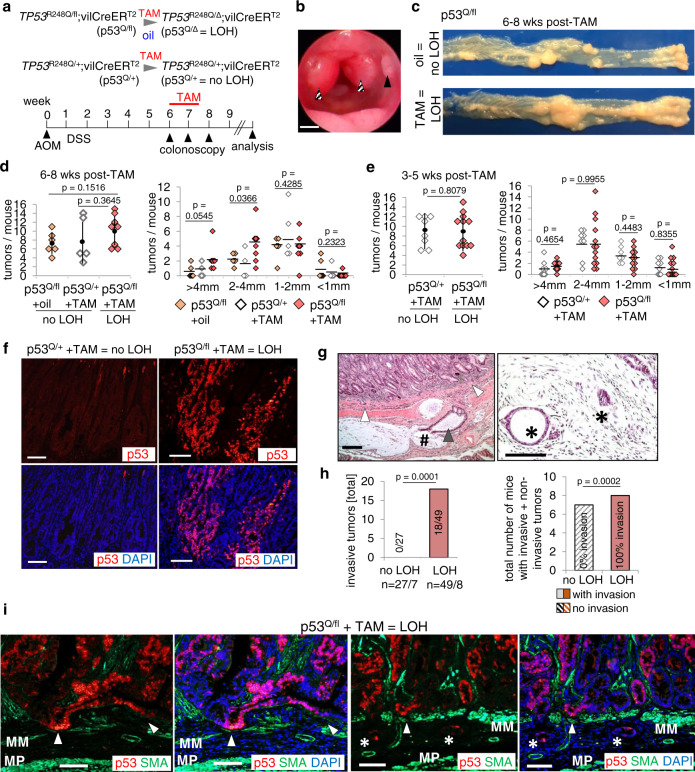
Fig. 1. p53LOH is a prerequisite for mutp53 stabilization and enables invasion in CRC.
a p53LOH induction scheme in intestinal epithelial cells. The GOF TP53R248Q allele (“p53Q”) is paired with the conditional wild-type Trp53 allele (p53fl). A constitutive WTp53 allele (“p53+”) serves as control. Colorectal tumors were initiated with AOM/DSS. At a defined tumor burden visualized by colonoscopy TAM (Tamoxifen) or oil treatment was administered. Oil-treated p53Q/fl;vilCreERT2 and TAM-treated p53Q/+;vilCreERT2 control mice carry heterozygous tumors (no LOH), whereas TAM-treated TP53R248Q/fl;vilCreERT2 (p53Q/Δ) mice carry p53LOH tumors. Mice were analyzed 2–8 weeks after LOH induction. b Representative colonoscopy of an untreated TP53R248Q/fl;vilCreERT2 mouse 8 weeks post AOM. Tumors with scores S2 (solid arrow) and S3 (dashed arrows)79. Scale bar, 1 mm. c Representative view of dissected colons of p53Q/fl mice 6 weeks after p53LOH induction. Left, ileocecal valve; right, anus. d Number of tumors per mouse (left) and tumor sizes (right) 6–8 weeks post TAM or oil treatment. Both “no LOH” groups had the same tumor burden. p53Q/fl + oil, n = 6; p53Q/+ + TAM, n = 5; p53Q/fl + TAM, n = 8. e Number of tumors per mouse (left) and tumor sizes (right) analyzed at 3–5 weeks post TAM. p53Q/+ + TAM, n = 8; p53Q/fl + TAM, n = 13. f Representative immunofluorescence of p53 for TAM-treated p53Q/+ and TAM-treated p53Q/fl mice at endpoint 6 weeks post TAM. Scale bars, 100 μm. g Representative H&E of two LOH p53Q/fl tumors 8 weeks after TAM. Left, extensive invasion within muscularis propria and muscularis mucosae (white arrows). One malignant gland (black arrow) is ruptured, spilling its content into mucous lakes with single tumor cells floating (#). Right, invading glands in submucosa (*). Scale bars, 100 µm. h (Left) total numbers of invasive tumors and (right) total numbers of mice with noninvasive and invasive tumors in the “no LOH” group (combined from oil-treated p53Q/fl and TAM-treated p53Q/+ mice) versus the “LOH” group (p53Q/Δ, TAM-treated p53Q/fl mice) analyzed at 6–8 weeks post oil/TAM. (Left) “no LOH”, n = 27 total tumors from seven mice and “LOH”, n = 49 total tumors from eight mice. (Right) “no LOH” n = 7 mice and “LOH” n = 8 mice. Both Fisher’s exact tests. (Left) noninvasive tumors were included in the statistical calculation. Bars, mean. i Stabilized mutp53 at the invasive front. Two tumors from different LOH mice 6 weeks post TAM. Representative immunofluorescence, p53 (red), α-SMA (green), and DAPI (blue). MM muscularis mucosae, MP muscularis propria. White arrows, tumor cells invading the MM. Asterix, small invasive cell clumps invading submucosa. Scale bars, 100 μm. d, e (Left) dots with vertical black lines represent means ± SD. (Right) horizontal black lines indicate means. Student’s t test, two-sided.

